
XRP trades above the $3.40 Fib 1.0 level; a flag breakout may push price toward the $4.16 target if momentum holds.
Strong moving average spread and rising OBV/A–D lines confirm long term bullish trend and sustained buying pressure.
Stochastic RSI is overbought, suggesting short term pullback risk, though outlook is bullish above $3.12 support.
XRP is holding strong above the key Fibonacci 1.0 level at $3.40, showing persistent bullish momentum. The token recently surged from under $2.00 to $3.50, confirming a breakout from a prolonged consolidation period.
Despite the current strength, analysts note the potential for a near term pullback, especially with the price trading inside a descending bullish flag pattern. The current setup suggests that a retest of lower support could still be possible before the next leg up.
Price Holds Key Level as Bull Flag Develops
At press time, XRP was trading at $3.50, just above the $3.3992 Fib 1.0 resistance level, now acting as support. The recent move placed XRP within a descending flag, a common continuation pattern in uptrending markets.
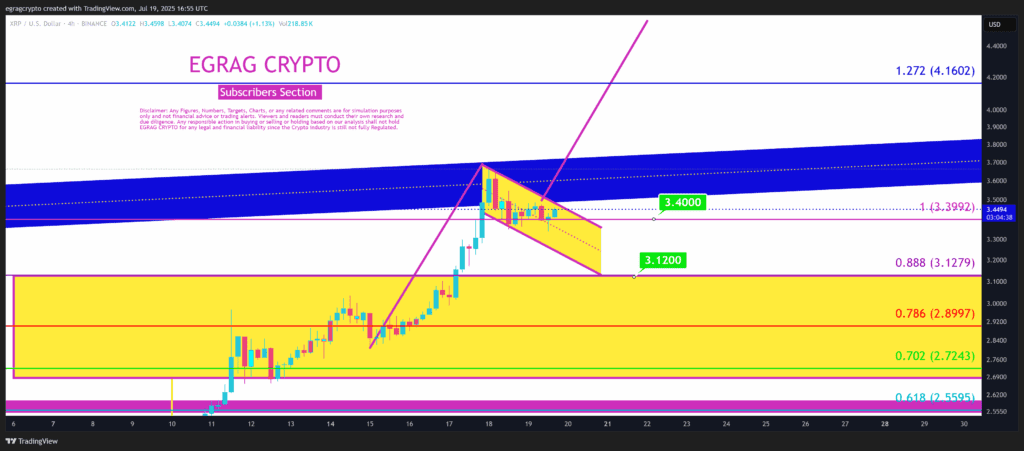 XRP/USD 4H price chart, Source: Egrag Crypto on X
If price action breaks above the flag upper trendline, bullish continuation toward $4.16 could follow. However, if the token revisits the Fib 0.888 level at $3.12, it could still support a bullish setup.
The Fib 0.888 level acts as a potential support. If bulls defend it, the structure is intact. On the downside, failure to hold $3.12 could open the way to further dips at $2.89, $2.72, or $2.55, which align with the Fib 0.786 to 0.618 zones.
Moving Averages and Volume Metrics
The average price is at $3.44, slightly below the current price, supporting positive short term momentum. The 50 day and 200 day moving averages remain widely apart, with the 50 day MA at $2.386 and the 200 day MA at $2.213. This golden cross pattern indicates long term strength in the trend. Volume indicators continue to show bullish conviction.
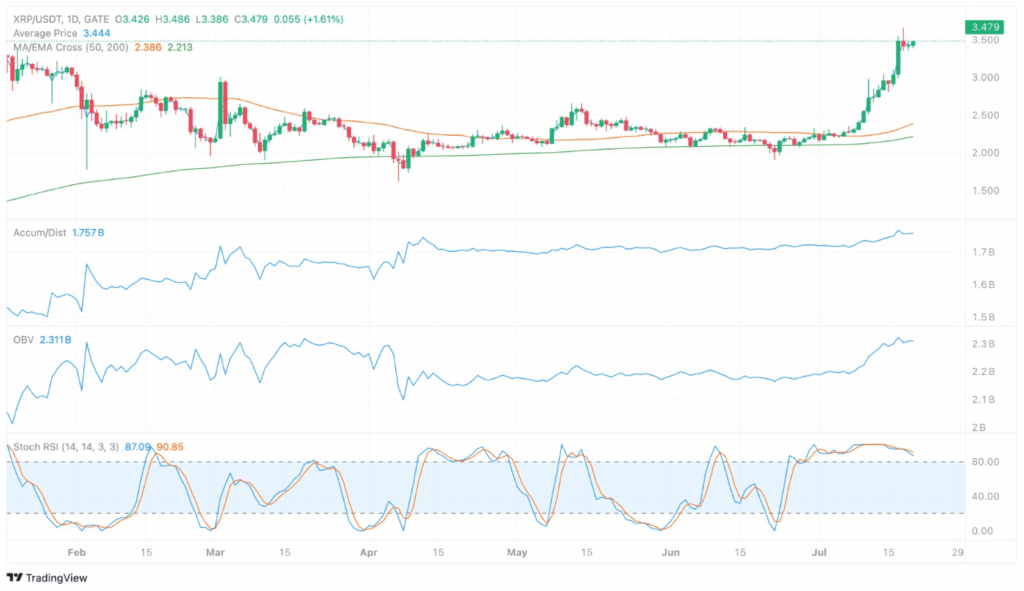 XRP/USDT 1-day price chart, Source: Gate.io
The Accumulation/Distribution (A/D) line has risen to 1.757B, while the On-Balance Volume (OBV) is at 2.311B. Both metrics have climbed steadily since early July, pointing to sustained buying pressure over the past few weeks.
Short Term Risks as Stochastic RSI Flash Overbought Signal
Momentum indicators now suggest caution in the short term. The Stochastic RSI reads %K at 87.09 and %D at 90.85, both in overbought levels. This may hint at a brief pullback or sideways action before continuation.
However, the overall outlook is bullish, supported by strong volume and positive price positioning. If XRP maintains levels above $3.12 and breaks above the descending flag, the next upside target is at $4.1602.
The post XRP Retest Still Possible as Price Holds Above $3.40 Support Zone, Says Analyst appears on Crypto Front News. Visit our website to read more interesting articles about cryptocurrency, blockchain technology, and digital assets.
