

XRP surged from $2.00 to $3.45, breaking Base 2 resistance and entering a steep parabolic phase with $8+ targets.
EMA ribbons and volume expansion confirm strong bullish momentum, though short term indicators show overbought risk.
Key support is at $2.70–$2.90; failure to hold may lead to re-accumulation, while breakout above $3.60 targets $4.00 next.
XRP has entered a potential parabolic phase, breaking past long standing resistance and gaining over 70% in less than three weeks. The latest price shows XRP surging from around $2.00 in early July to $3.45.
This move is the most aggressive upward change since 2021. According to Meta Warior’s chart, the token may be transitioning from Base 2 into the steepest part of a larger parabolic structure.
If this momentum sustains, XRP could be heading toward the high velocity “needle” phase, historically marked by fast price appreciation and vertical growth.
Market Pattern Break Suggests Aggressive Momentum
The parabolic model shows XRP completing two base cycles, Base 1 from 2014 to 2017 and Base 2 from 2018 to 2024. XRP has now broken above the Base 2 resistance and entered Base 3, which typically leads to vertical movement.
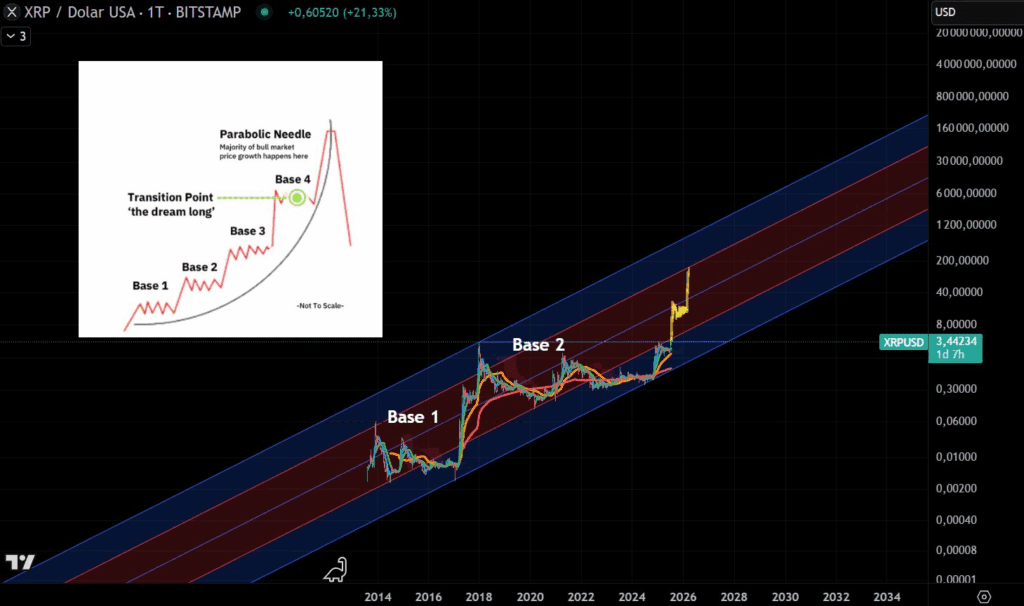 XRP/USD price chart, Source: Meta Warior
The current move aligns with the log regression bands, where XRP has climbed above the midline between $1.50 and $2.00. The next level of interest, according to the model, is around $8.00, with long term upside extending to $40 or even $100 if the pattern holds.
The EMA ribbons have turned upward and fanned out. This technical alignment confirms that the bullish trend is strong and accelerating. Volume expansion further supports the strength of this move.
Short Term Overbought Signals
Despite the bullish macro structure, technical indicators show potential short term exhaustion. XRP is trading near the upper Bollinger Band at $3.6090, a level that often acts as resistance.
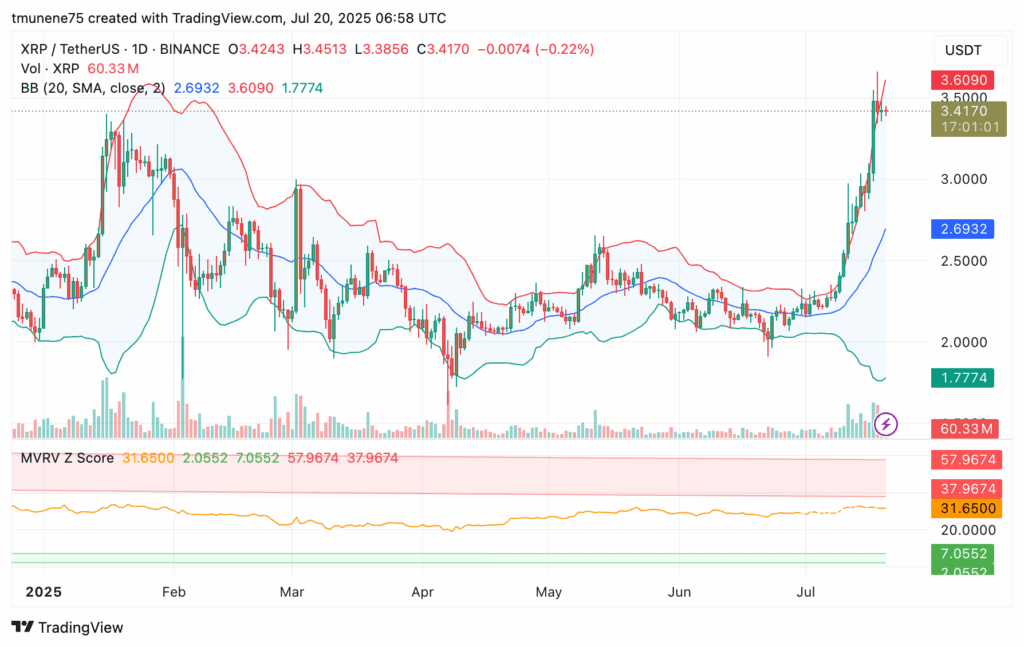 XRP/USDT 1-day price chart, Source: TradingView
Sustained movement along the upper band typically suggests strong buying pressure, but also hints at overbought conditions. Additionally, the MVRV Z Score is at 31.65, far above the historical red zone level of 7.0.
Previous peaks in this metric, in February and April, aligned with short term tops. This elevated reading could mean a cooling phase or pullback is likely if the momentum weakens.
Price Levels to Watch
XRP’s rally is supported by high volume, at 60.33 million, which confirms active market activity. The recent breakout above $2.70 led to this surge, and that level now acts as a key support. Failure to stay above $2.70–$2.90 may lead to re-accumulation or invalidate the parabolic trend.
Looking ahead, the $3.60 region is the next resistance. A move above it could lead toward the $4.00 psychological level. However, if XRP fails to maintain current momentum, a short term correction is possible.
Overall, XRP has moved into a high velocity price zone with rising volume, bullish trend strength, and aggressive structural alignment. Despite short term risks, the broader pattern shows a phase with historic growth potential.
The post XRP Enters Parabolic Phase With Eyes on $100 as Momentum Builds Fast appears on Crypto Front News. Visit our website to read more interesting articles about cryptocurrency, blockchain technology, and digital assets.

