Price Action & Breakout: Ethereum has delivered a strong weekly rally, up ~20% in the past 7 days and clearing major resistance near $3,300–$3,500. The weekly candle closed well above this zone, signaling a decisive bullish breakout. ETH is now trading above all key EMAs (20/50/100/200), a classic sign of sustained uptrend. Analysts are optimistic: BraveNewCoin reports “short-term targets in the $3,800 to $4,000 range” as the next objective, with some even eyeing a rise to ~$4,100.
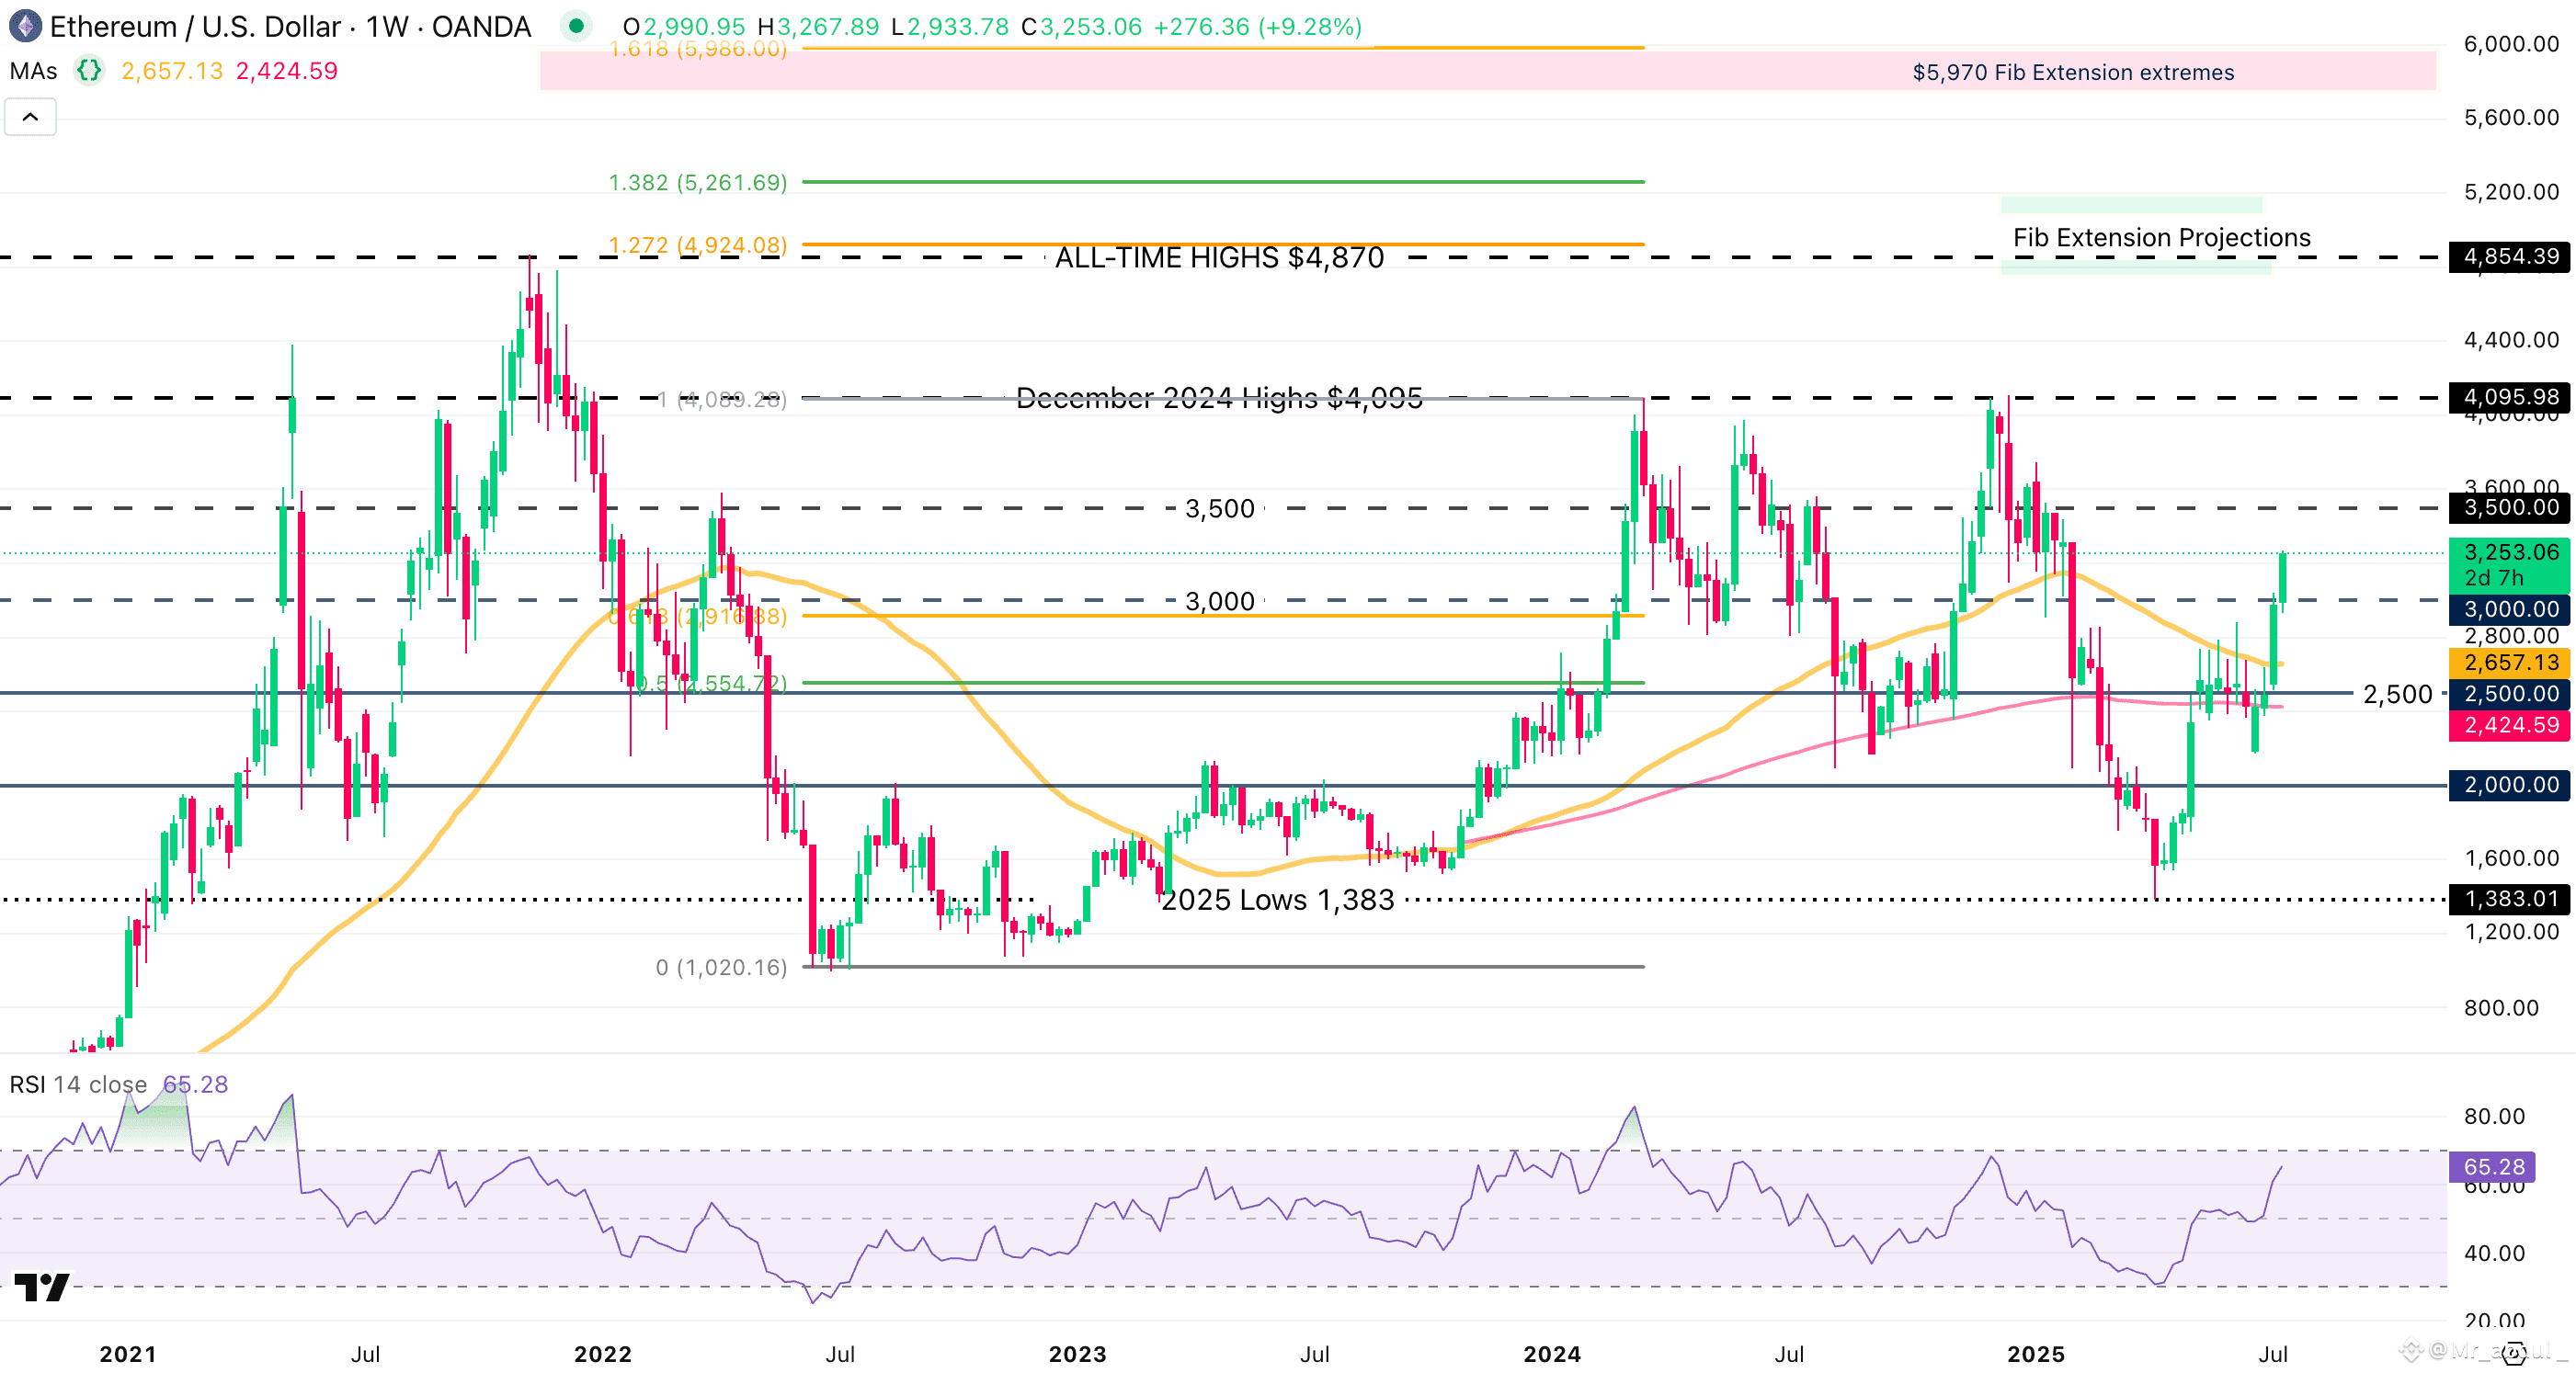
Chart Patterns: The weekly chart shows ETH breaking out of a multi-week consolidation (ascending triangle/bull channel). A clear break above ~$3,250–$3,300 (recent resistance) turned that zone into new support. This structure implies continuation to new highs as long as ETH stays above ~$3,350–$3,400.
Momentum Indicators: Key oscillators are bullish. The RSI on the weekly chart is climbing into bullish territory (around ~60+ currently), and the MACD has crossed positively with a widening gap. OKX highlights an Ichimoku “golden cross” and rising RSI as additional confirmation of upward momentum. These signals suggest buyers remain in control, despite RSI nearing overbought.
Support & Resistance: Major support now lies at the former resistance band (~$3,300–$3,500). Below that, $3,000–$3,200 and $2,700–$2,800 are key fallback zones. On the upside, immediate resistance is around $3,680–$3,880 (recent swing highs). Clearing those would open a path to the next targets near $4,000–$4,100.
Volume & Flows: The breakout is backed by surging volume and capital inflow. Ethereum spot ETFs saw record inflows (~$2.18B last week), and trading activity spiked – on-chain volume jumped ~280% in about two weeks. Derivatives data show a strong long/short bias (Binance reports a 2.82 long/short ratio) and a 63% surge in options volume. These flow-driven volumes reinforce the bullish move.
Ecosystem & Demand: Beyond price charts, Ethereum’s network fundamentals remain robust. DeFi TVL recently topped $80+ billion (over 10× Solana’s), indicating heavy use of ETH’s platform. Stablecoin market cap is also near record highs. In other words, demand metrics are strong. Even though the RSI is high (around 84), technical models (e.g. Wyckoff accumulation) suggest any short consolidation could set up the next leg higher. Traders note that historically, overshoots like this often pause briefly; a shallow pullback to support ($3.3K–$3.5K) could offer a better entry before resuming the uptrend.
Whales & Sentiment: Large investors are piling in. On-chain data (Ali Martinez) show long-term holders adding nearly 1.5M ETH in July (a 95% jump month-over-month). Corporate treasuries are also buying – e.g. SharpLink Gaming now holds >111K ETH. With spot ETFs at new highs and staking yields attractive, institutional interest is fueling price. All told, market sentiment is extremely bullish: ETH’s recent breakout and risk-off indicators (e.g. strong long-bias) imply traders expect more upside. In summary, the weekly technicals paint a strongly bullish picture – as long as ETH holds above the $3,300–$3,400 zone, it looks poised for a breakout toward $4,000+.
🚀 Ethereum Bulls in Control!
Weekly $ETH closed strong above key resistance with RSI & MACD flashing green. Whale accumulation and record ETF inflows are driving momentum. Eyes on $4,000 – breakout next! 📈💪
