Technical analysis (TA) is one of the most powerful tools a trader has to anticipate market movements. Unlike fundamental analysis, TA is based on historical price and volume behavior, using charts and patterns.
🛠 Key tools every trader should know:
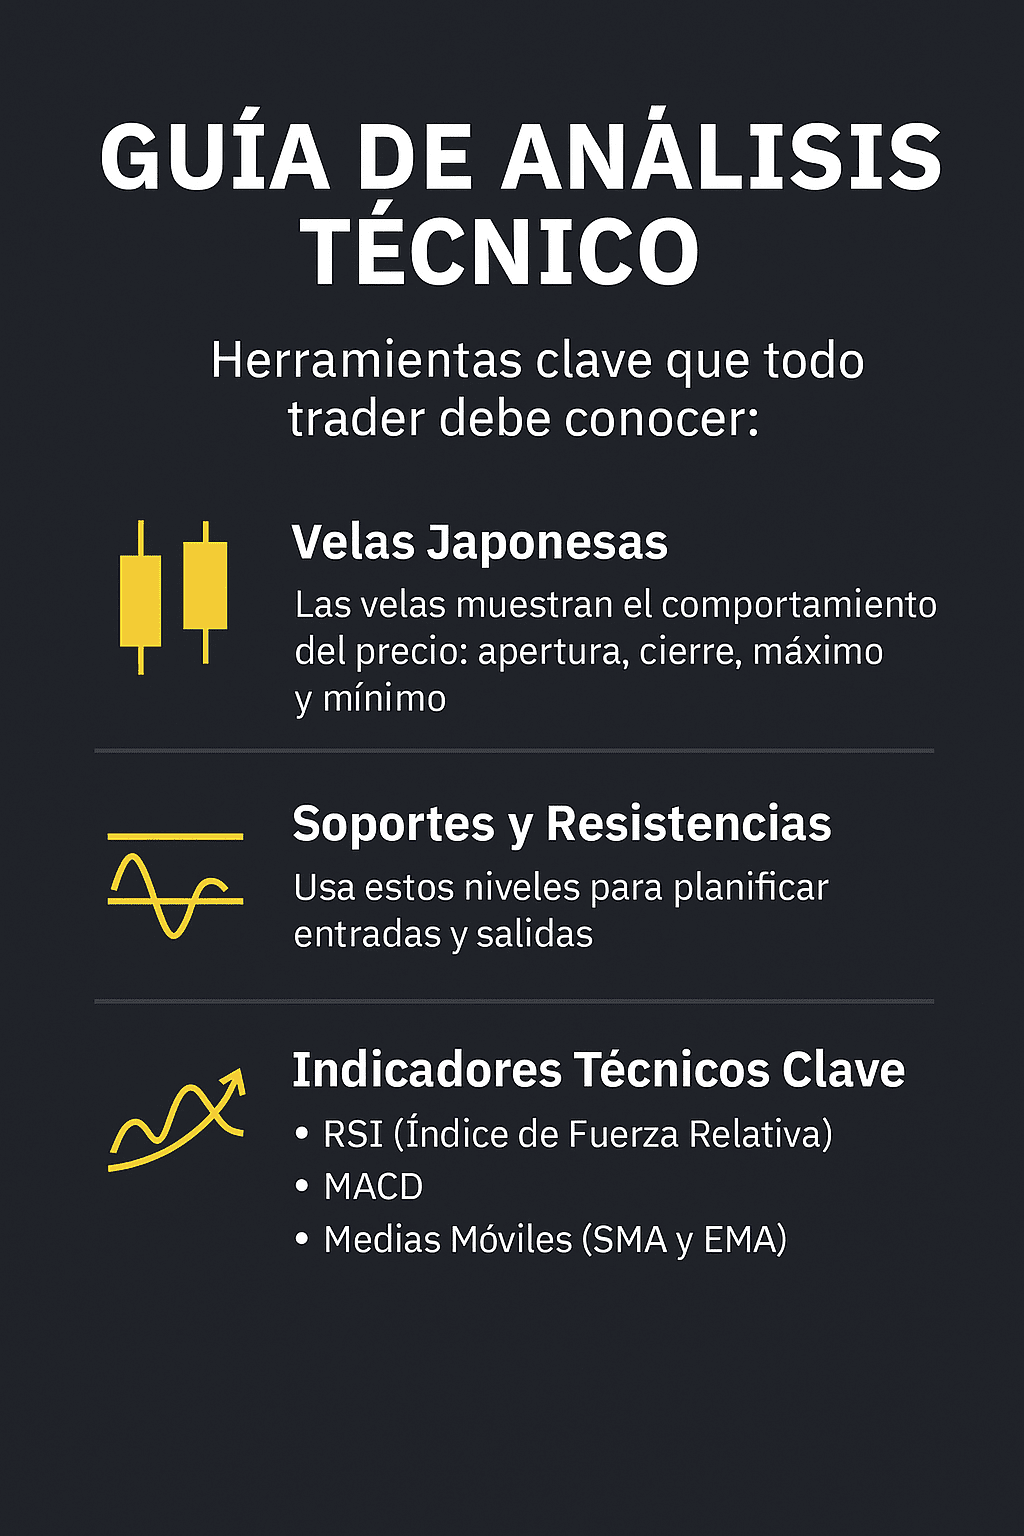
1. Japanese Candles
Candles show the price behavior in a specific period: open, close, high, and low.
Common example:
Hammer: bullish reversal signal.
Shooting Star: possible drop after a surge.
2. Supports and Resistances
Support: level where the price tends to stop its decline.
Resistance: area where the price tends to stop its advance.
Traders use these levels to plan entries and exits.
3. Key Technical Indicators
RSI (Relative Strength Index): Measures if an asset is overbought (>70) or oversold (<30).
MACD: Indicates trend crossings with two moving averages.
Moving Averages (SMA and EMA): Smooth the price to identify trends.
🧠 Practical recommendations:
Always use longer time frame charts (1D, 4H) to identify the main trend.
Enter trades in favor of the trend, not against it.
Rely on multiple confirmations, not just one indicator.