SUI is quickly becoming a name to watch in the crypto space. Despite being a relatively new asset, it has already made waves with sharp volatility and surging volume. This report dives deep into the current market dynamics, technical signals, and what lies ahead for SUI.
📊 Market Snapshot (Last 24 Hours)
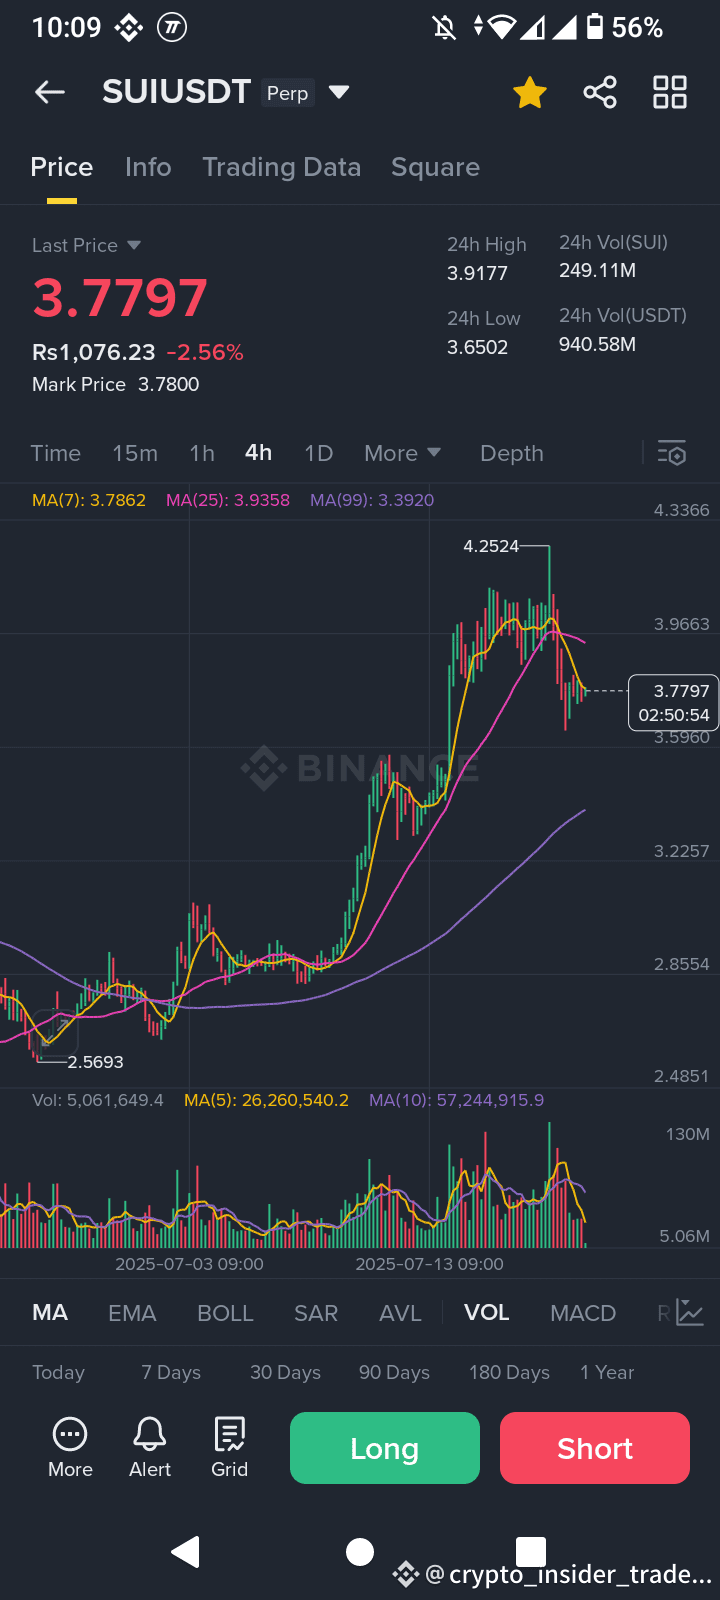
🔸 Last Price: 3.7838 USDT (▼2.50%)
🔺 24h High: 3.9214 USDT
🔻 24h Low: 3.6500 USDT
💰 Volume (SUI): 228.98M
🔄 Turnover (USDT): 864.3M
📉 Mark Price: 3.7832 USDT
A slight dip in the mark price vs. the last trade indicates ongoing bearish pressure.
📈 Technical Analysis
✅ Moving Averages (MA)
MA(5): 3.7868
MA(10): 3.8435
MA(20): 3.9196
> The current price is below all key moving averages, signaling a short-term bearish structure. The growing gap between MA(20) and price shows rising sell-side strength.
✅ MACD
MACD: -0.0373
DIF: -0.0112
DEA: 0.0262
> The negative MACD and a DIF line below the signal line confirm strong bearish momentum. A potential crossover may hint at a reversal—stay alert.
✅ Support & Resistance
Immediate Support: 3.6500
Next Key Support: 3.6100
Resistance to Break: 3.9214
> A break below support could intensify selling, while breaching resistance may kickstart a bullish leg toward 4.0000.
⏳ Historical Performance Overview
ATH: 4.4183 USDT (early July)
Recent Peak: 4.2582
Current Trend: Downward sloping
SUI’s 13% price lift earlier this month triggered excitement, but recent pullbacks hint at profit-taking and consolidation.
📰 Market Sentiment & News
Bulls’ Take: Growth in the SUI ecosystem, new DApps, and integrations suggest long-term upside.
Bears’ View: Weak follow-up volume, price slippage, and macro concerns fuel caution.
> Catalysts to Watch:
🔹 Upcoming network upgrades
🔹 Exchange listings
🔹 Ecosystem expansion announcements
> 📌 SUI is becoming a go-to choice for short-term traders due to its price swings and liquidity.
🔮 Future Outlook
Timeframe Expectation Key Levels
Short-Term (1–7 days) Range-bound between 3.6500–3.9214 Look for breakout on volume
Mid-Term (1–3 months) Above 4.0000 = Bullish continuation Below 3.6000 = Deep correction
> ⚠️ Neutral-to-bearish bias unless clear reversal signs appear. Keep risk tight.
🧠 Conclusion
SUI’s performance is turbulent but full of potential. For savvy traders, this is a chance to capitalize on the volatility. For investors, it’s a reminder to keep eyes on fundamentals and market triggers.
💡 Final Thoughts
SUI isn’t just another token—it’s building an identity. Whether you’re a scalper, swing trader, or long-term investor, now is the time to keep it on your radar. With the right timing and research, SUI could be your next breakout trade.
⚠️ Disclaimer: This report is for informational purposes only. Not financial advice. Do your own research (DYOR). Trade responsibly.