The **Relative Strength Index (RSI)** is one of the most widely used technical analysis tools in trading. Whether you're trading stocks, forex, or cryptocurrencies, the RSI helps traders identify overbought and oversold conditions, potential trend reversals, and momentum shifts.
In this guide, we’ll break down:
- What the RSI indicator is
- How to calculate RSI
- How to interpret RSI signals
- Common RSI trading strategies
- Limitations of the RSI
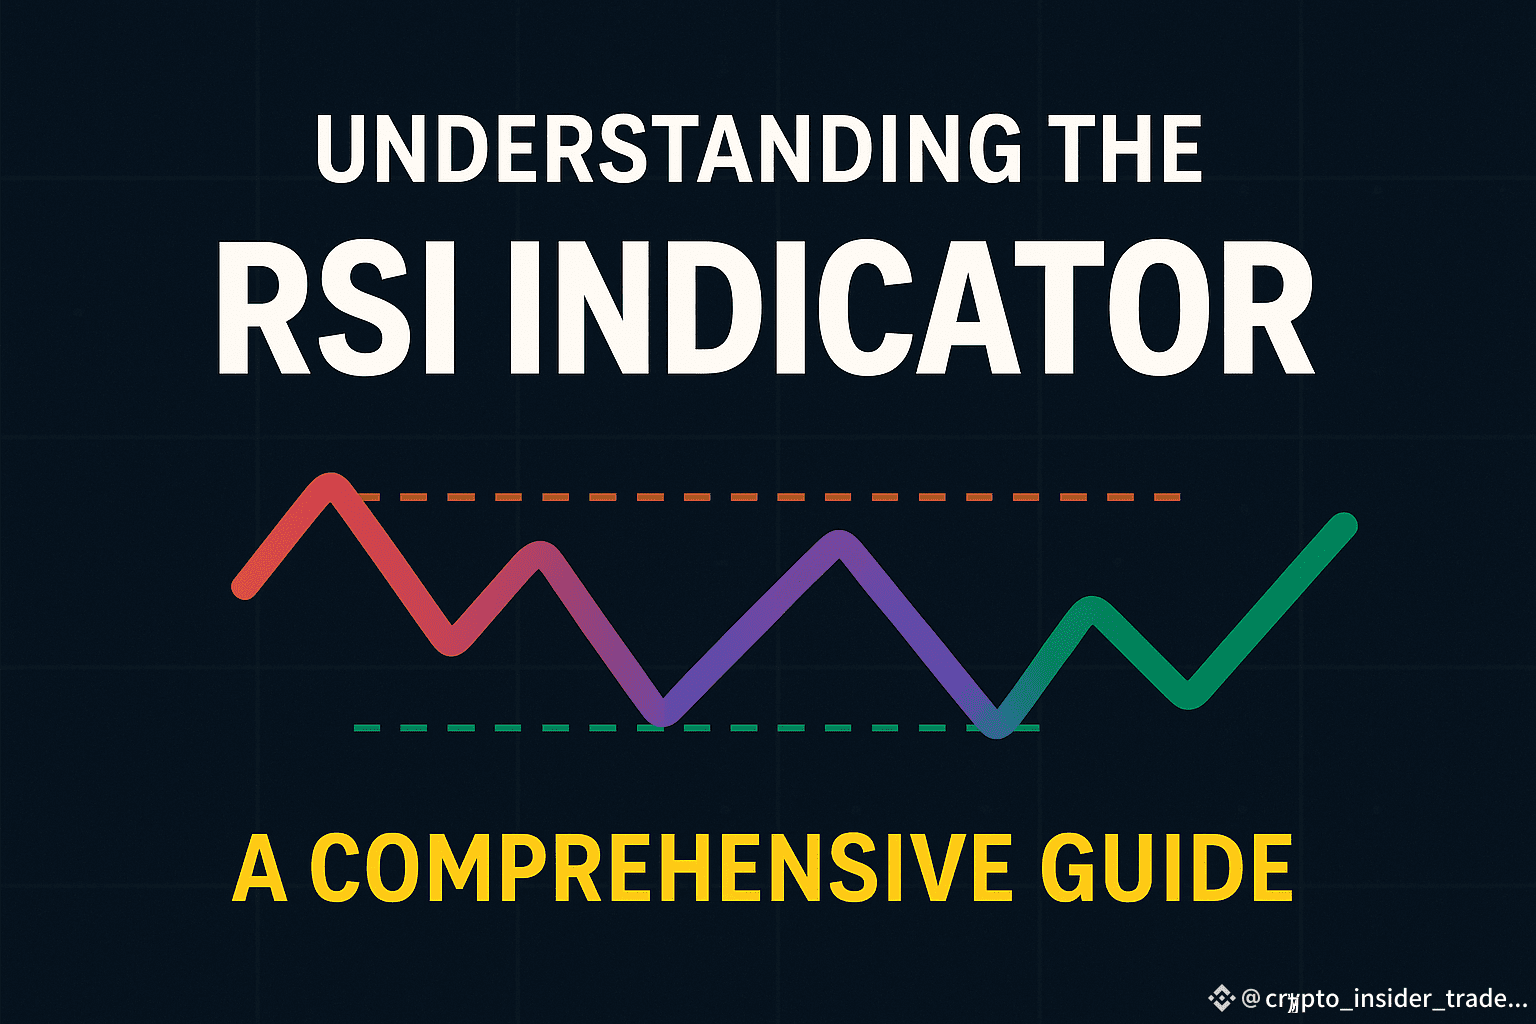
## **What Is the RSI Indicator?**
The **Relative Strength Index (RSI)** is a **momentum oscillator** developed by J. Welles Wilder in 1978. It measures the speed and change of price movements on a scale of **0 to 100**, helping traders identify:
- **Overbought conditions** (typically above 70)
- **Oversold conditions** (typically below 30)
- **Divergences** (when price and RSI move in opposite directions)
- **Potential trend reversals**
Unlike simple moving averages, the RSI focuses on **price momentum**, making it a powerful tool for short-term and swing traders.
## **How Is RSI Calculated?**
The RSI formula involves two main steps:
### **Step 1: Calculate Average Gain and Average Loss**
RSI uses a **14-period** default setting (but traders can adjust this).
- **Average Gain** = Sum of gains over the last 14 periods / 14
- **Average Loss** = Sum of losses over the last 14 periods / 14
### **Step 2: Compute the Relative Strength (RS) and RSI**
- **RS** = Average Gain / Average Loss
- **RSI** = 100 – (100 / (1 + RS))
A higher RSI (above 70) suggests an asset may be **overbought**, while a lower RSI (below 30) suggests it may be **oversold**.
## **How to Interpret RSI Signals**
### **1. Overbought & Oversold Conditions**
- **RSI > 70** → Overbought (Potential Sell Signal)
- **RSI < 30** → Oversold (Potential Buy Signal)
*Example:* If Bitcoin’s RSI hits **75**, traders might expect a pullback. If it drops to **25**, a bounce could follow.
### **2. Bullish & Bearish Divergences**
- **Bullish Divergence:** Price makes a **lower low**, but RSI makes a **higher low** → Possible upward reversal.
- **Bearish Divergence:** Price makes a **higher high**, but RSI makes a **lower high** → Possible downward reversal.
### **3. RSI Centerline Crossover (50 Level)**
- **RSI > 50** → Bullish momentum
- **RSI < 50** → Bearish momentum
## **Popular RSI Trading Strategies**
### **1. Classic Overbought/Oversold Strategy**
- **Buy** when RSI crosses **above 30** (exit oversold).
- **Sell** when RSI crosses **below 70** (exit overbought).
### **2. RSI Divergence Trading**
- Look for divergences between price and RSI to predict reversals.
### **3. RSI Trendline Breakouts**
- Draw trendlines on the RSI itself—breakouts can signal entry/exit points.
### **4. RSI + Moving Averages (Confirmation Tool)**
- Combine RSI with **50-day or 200-day MA** for stronger signals.
## **Limitations of RSI**
While powerful, RSI has weaknesses:
- **False Signals in Strong Trends:** In a strong uptrend, RSI can stay overbought for long periods (and vice versa).
- **Lagging Nature:** Since RSI is based on past prices, it may not predict sudden market shifts.
- **Works Best with Other Indicators:** Pair RSI with MACD, Bollinger Bands, or volume indicators for better accuracy.
## **Conclusion: Should You Use RSI?**
Yes! The **RSI indicator** is a must-have for traders looking to gauge momentum and spot potential reversals. However, always:
✅ Use it with other indicators (like moving averages or volume).
✅ Adjust RSI periods (e.g., 9 for short-term, 25 for long-term).
✅ Avoid relying solely on RSI in strong trending markets.
By mastering RSI, you can improve your entries, exits, and overall trading strategy.