
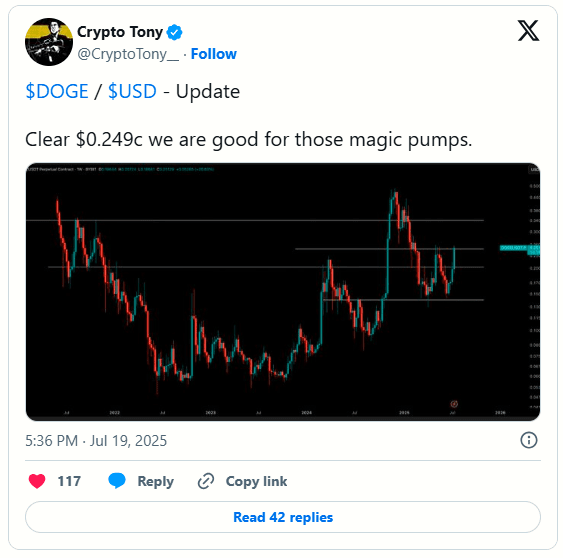
Dogecoin has recently surpassed the significant resistance level of $0.249, a zone that previously served as both support and resistance. This breakout signals a potential shift in market structure. Historically, DOGE prices have tended to rise after similar technical breakouts, underscoring the importance of this level.
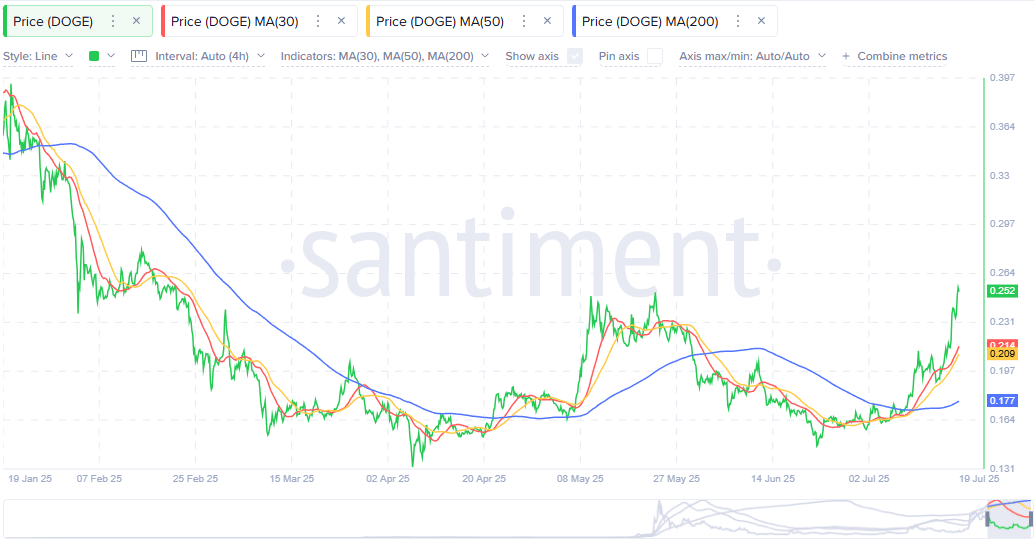
This breakout comes along with an increase in volume and a rise in short-term moving averages. The 30-period and 50-period moving averages have crossed above the 200-period moving average on the 4-hour chart. This crossover pattern, often referred to as a bullish crossover, reflects an improving market sentiment for DOGE.
Technical Indicators Show Upward Momentum
Recent chart volatility indicates that Dogecoin has entered a new growth phase. After months of consolidation and downtrends, the current breakout momentum suggests that accumulation may have shifted into expansion. Moving averages now provide dynamic support as DOGE trades above them.
Traders are closely monitoring this development, as the upward trend appears to be supported by both volume and structure. If the price holds above $0.249, historical chart patterns indicate the potential for prices to continue rising higher. Consistent closing prices above this level could attract new capital. $DOGE
