
XRP has seen an incredible growth of 24% this week, reaching a multi-year high of $3.27 and pushing market capitalization above $190 billion for the first time.
This explosive bull run coincides with the NYSE listing of the ProShares Ultra XRP ETF on July 18, marking the first exchange-traded fund linked to XRP traded on a major U.S. exchange.
XRP is currently trading at $3.25 and is only 15% below the all-time high of $3.84 set in January 2018.
Notably, open perpetual futures hit a record $8.8 billion during the bull run, corresponding to nearly 2.9 billion XRP in leveraged contracts.
Similarly, California Governor Gavin Newsom launched the California Breakthrough Project at Ripple's headquarters, adding government credibility to XRP's utility.
Technical analysis shows XRP has completed a seven-year symmetrical triangle pattern, with Fibonacci targets indicating a short-term range of $4.70 - $6.48.
Historical cycle analysis suggests the price could move toward the $22-23 level.
Channel Breakout Target $4.70-$6.48
XRP's daily chart shows a transition from a bearish channel to a bullish structure, with a recent breakout indicating a significant pattern change.
This cryptocurrency has risen 126% since the low in April, surpassing previous resistance at around $2.50-$3.00.
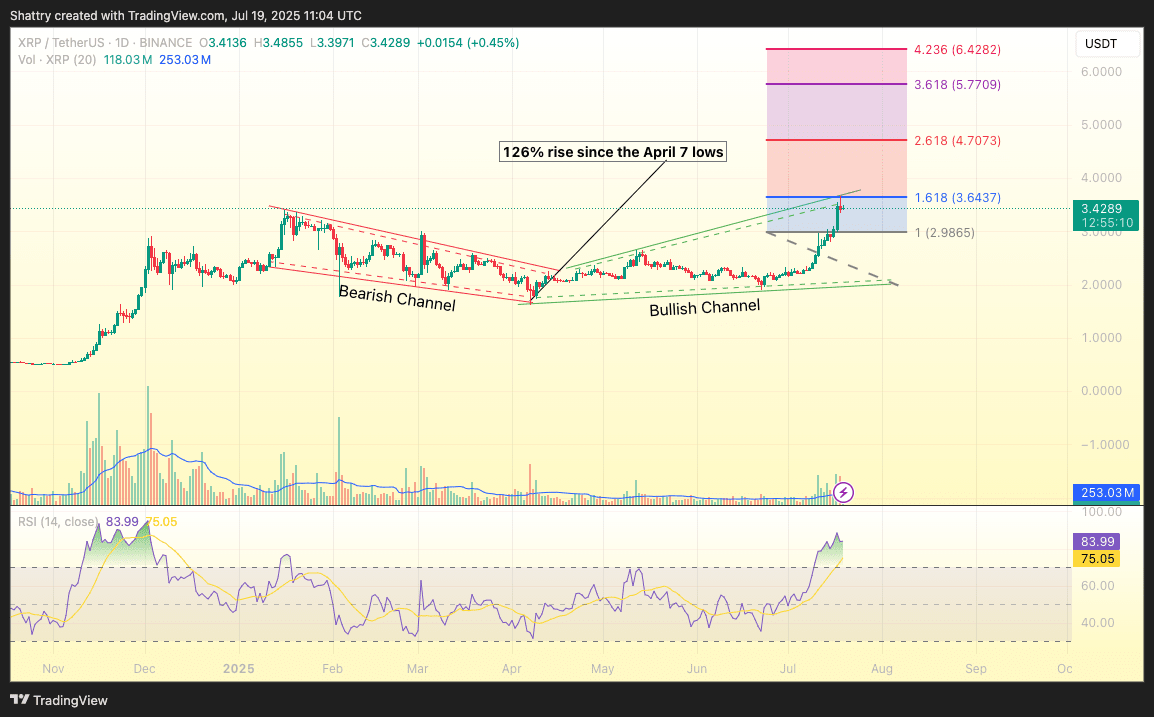
Fibonacci extension analysis provides a clear bullish target after the channel breakout.
Immediate resistance is at the 1.618 level around $3.64, a level that XRP is currently testing.
The 2.618 extension level at $4.70 is the next primary target, followed by the 3.618 level at $5.77 and the 4.236 extension reaching $6.48.
Volume confirmation during the breakout also indicates significant institutional interest driving this move.
Furthermore, the RSI above 80 signals overbought conditions, but parabolic moves often maintain high momentum for extended periods.
Completion of the 7-Year Triangle Towards Target $22
According to a technical analyst on X, XRP's weekly chart shows that the current breakout is within a larger symmetrical triangle pattern that has developed since the 2018 peak.
Currently at $3.15, XRP appears to be completing a seven-year consolidation structure that includes multiple market cycles.
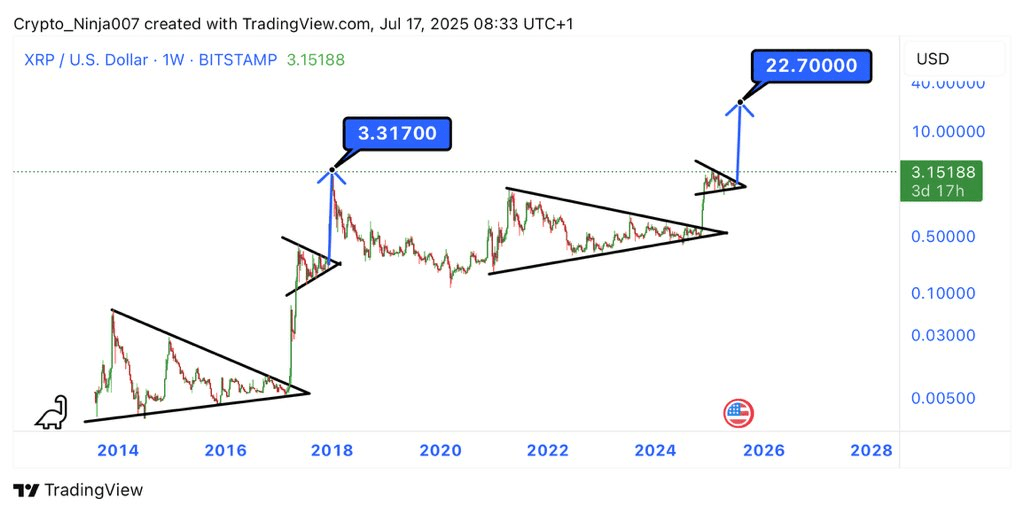
The convergence of the triangle near the current timeframe makes this breakout particularly important.
Historical Fibonacci analysis suggests XRP could reach $22.70 by August 1, based on mathematical relationships similar to those characteristic of the 2017-2018 cycle.
The previous major wave has established Fibonacci ratios that could drive the current cycle toward the $22-23 range.
Completing the model after seven years of consolidation will create strong technical momentum.
The current support range of $2.50-$3.00 represents the triangle breakout area that could sustain to continue the bullish trend toward higher Fibonacci forecast levels.