

As we talk before I'm sharing my first article about candle stick pattern hope so it'll helpful for you....
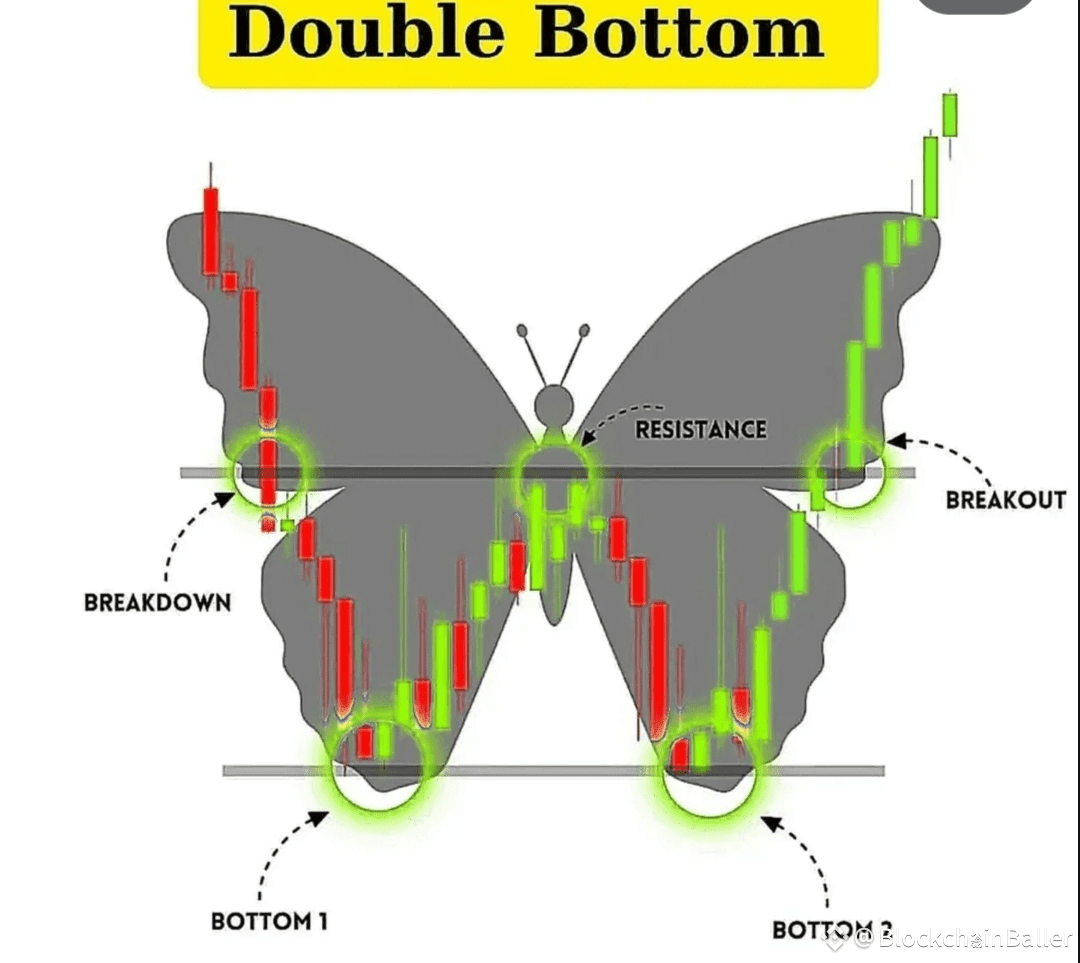
DOUBLE BOTTOM
Double Bottom pattern is a bullish reversal signal that forms after a downtrend when the price creates two distinct lows at the same level, indicating strong support. Once the price breaks above the resistance level between the two bottoms, it confirms the pattern and suggests a potential upward trend. Traders view this breakout as a buying opportunity, anticipating continued price growth.
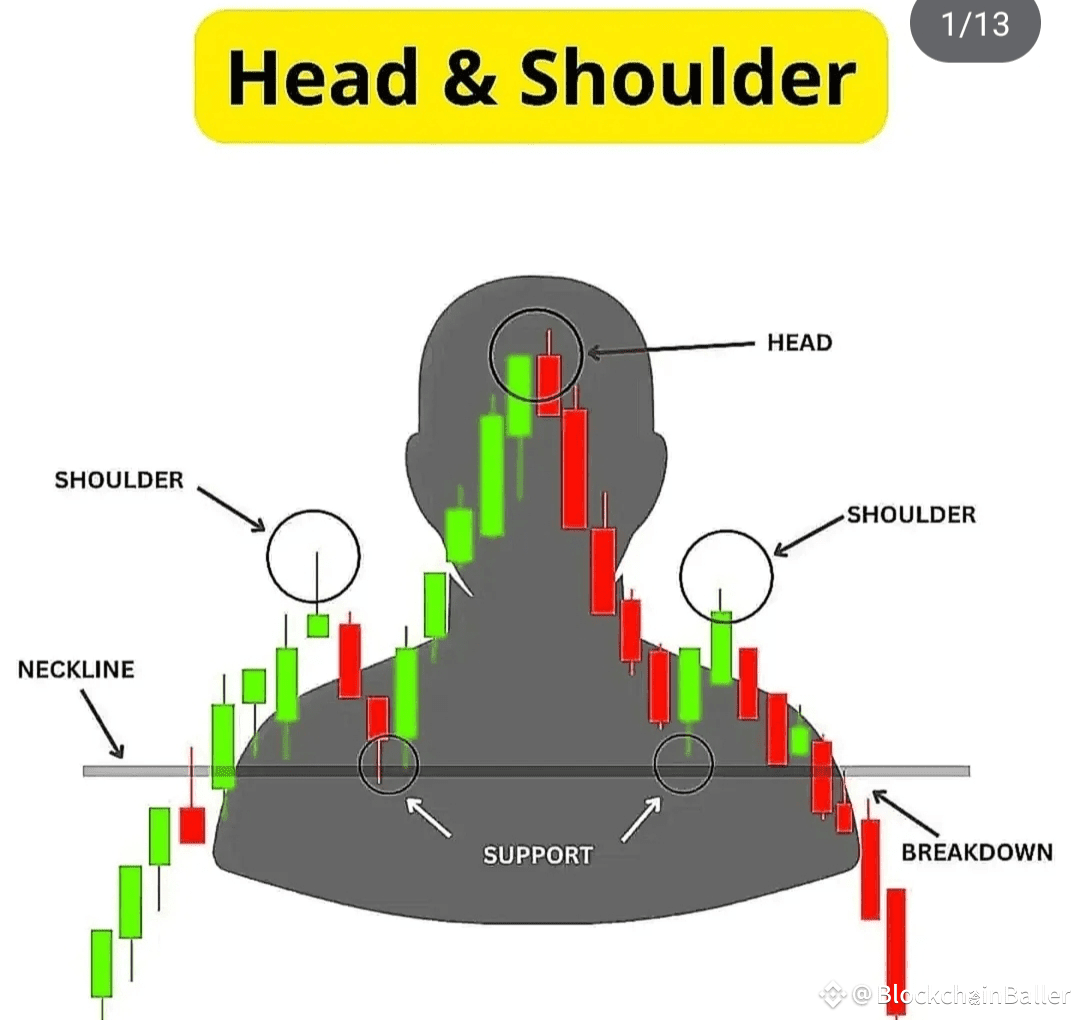
HEAD & SHOULDER
Head & Shoulder pattern is a classic technical analysis formation that signals a potential trend reversal from bullish to bearish. It is confirmed when the price breaks below the neckline, indicating a shift toward a downtrend and presenting a potential short-selling opportunity for traders.
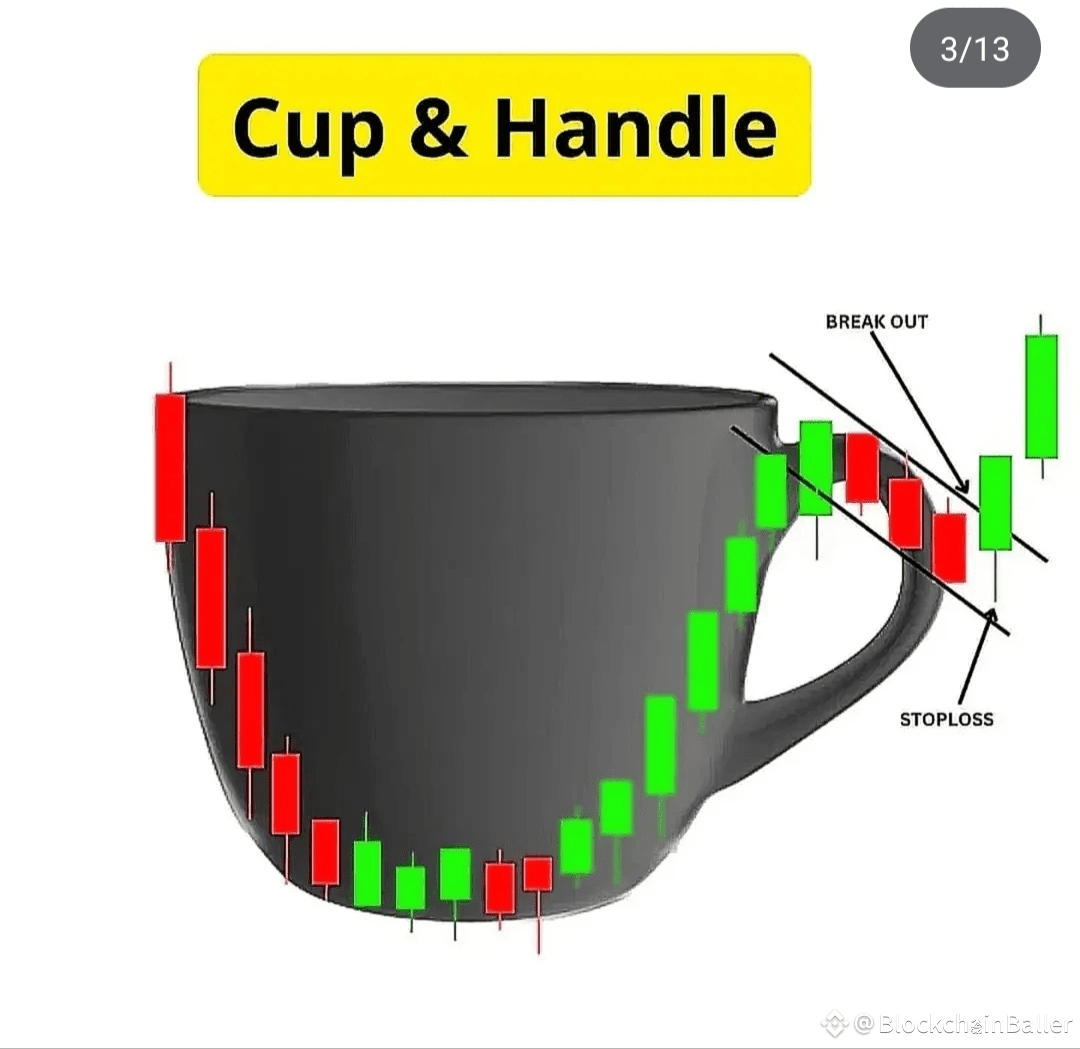
CUP & HANDLE
Cup and Handle pattern is a bullish continuation formation that signals the potential for further price increases. It forms when the price first creates a rounded bottom resembling a cup, followed by a small downward drift known as the handle. A breakout occurs when the price moves above the resistance formed at the cup's top. Traders often place a stop loss below the handle to manage risk and enter the trade on the breakout for a potential upward move.
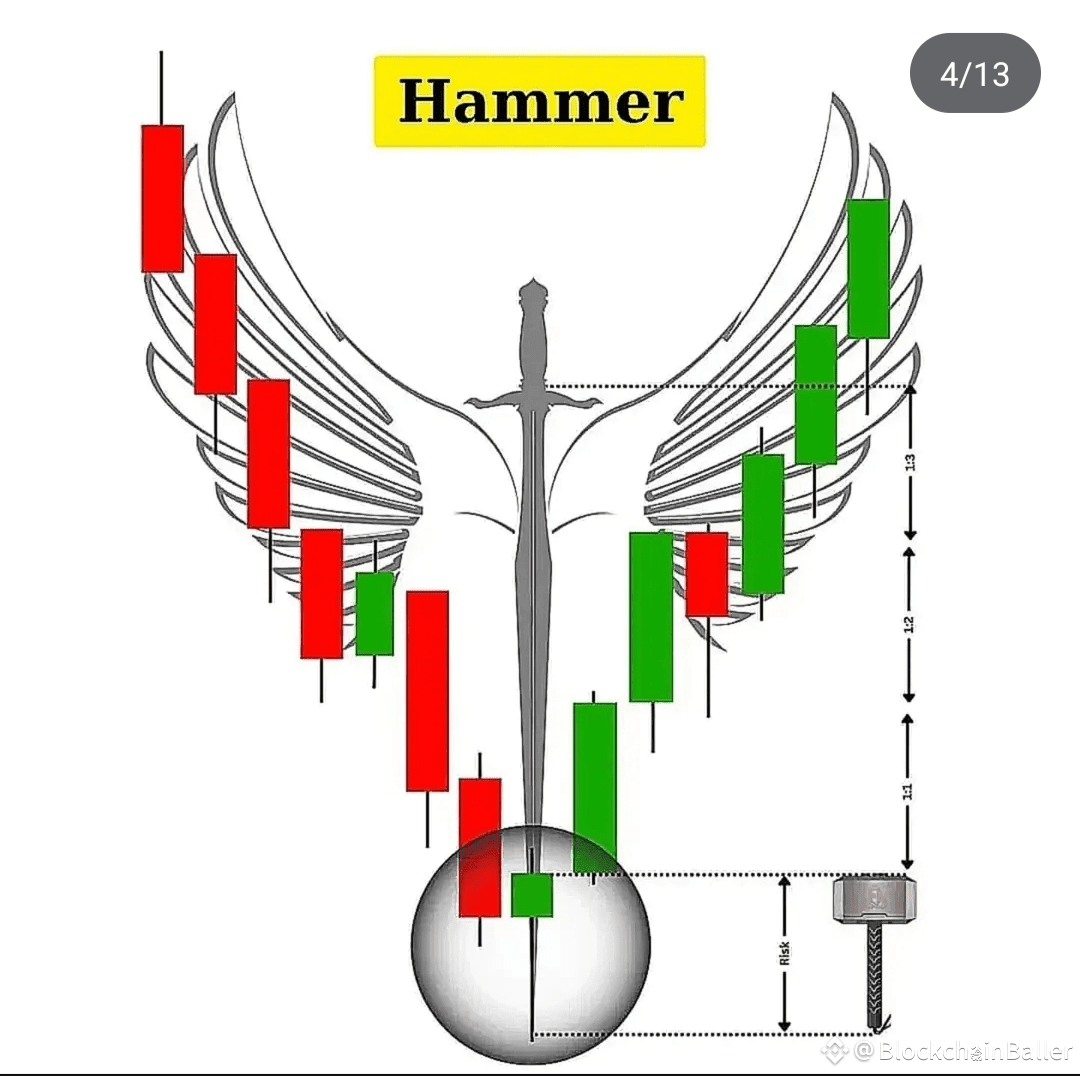
HAMMER
Hammer is a bullish candlestick pattern that typically forms at the bottom of a downtrend, signaling a potential reversal. It features a small body with a long lower wick, showing that buyers pushed the price back up after strong selling pressure. When a hammer appears after a decline, it indicates that sellers are losing control and buyers may take over, often leading to a price increase. Traders use this pattern to spot buying opportunities with a defined risk level below the hammer's low.
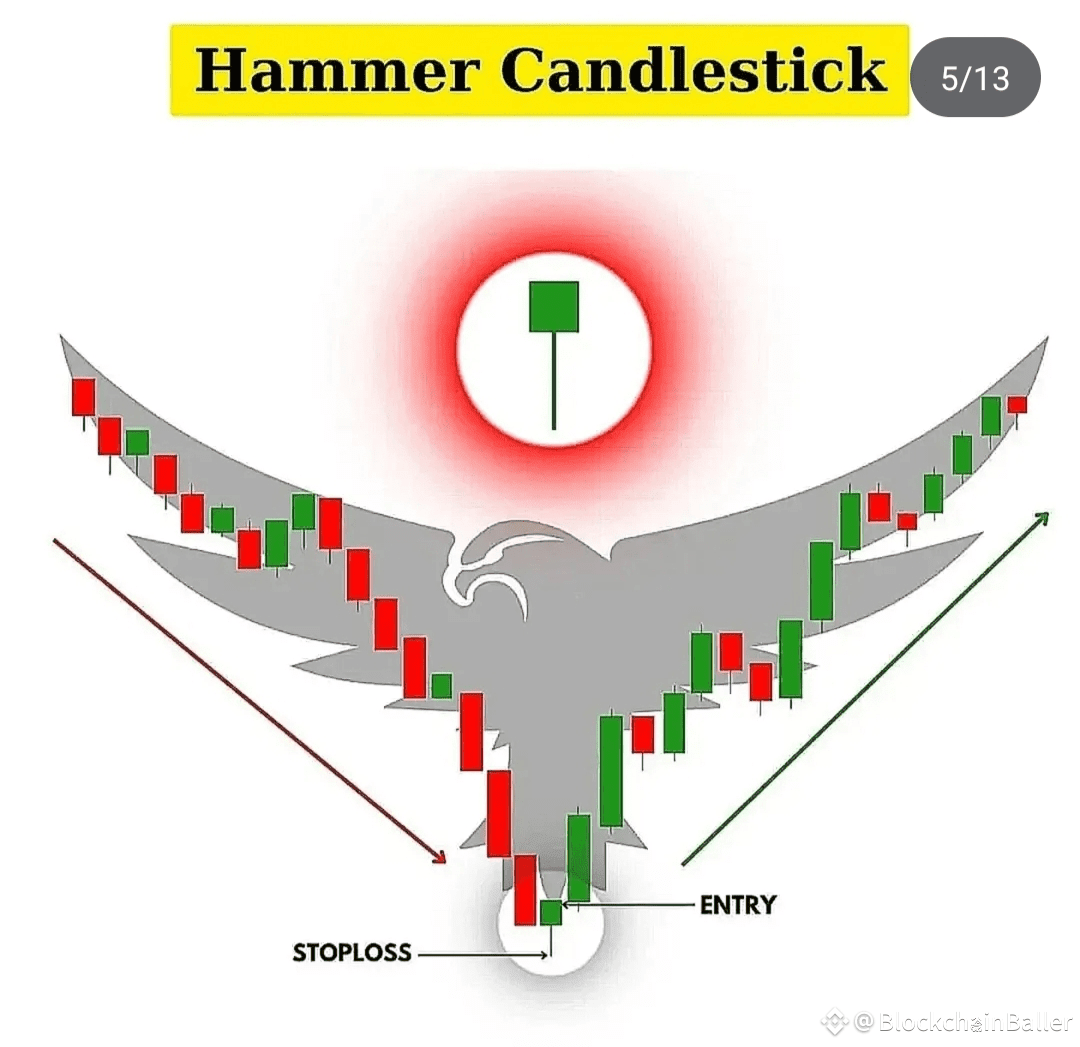
HAMMER
Hammer Candlestick is a powerful reversal signal that appears after a downtrend, indicating a possible shift from selling to buying pressure. It has a small body with a long lower wick, showing that buyers pushed the price up after a deep sell-off. Traders typically enter a buy position after the hammer forms, placing a stop loss below its low to manage risk, and aim to ride the upward trend that often follows.
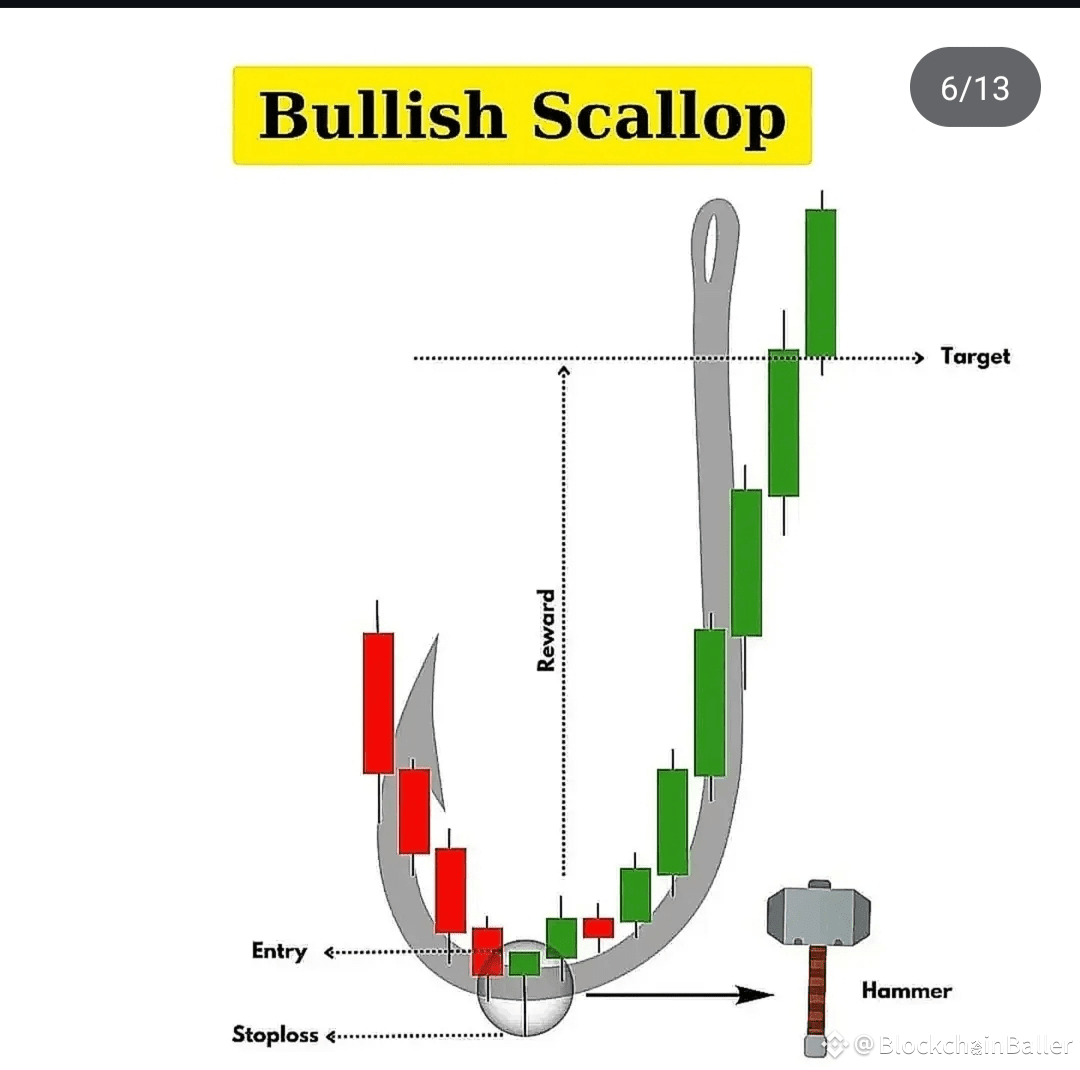
BULLISH SCALLOP
Bullish Scallop is a continuation pattern that signals the start of a strong upward move after a brief pullback. It forms when the price gradually curves down and then quickly reverses upward, creating a hook-like shape. Traders typically enter at the curve's bottom, set a stop loss just below, and aim for higher price targets as the trend accelerates. This pattern often appears after the formation of a hammer candlestick, confirming the bullish reversal.
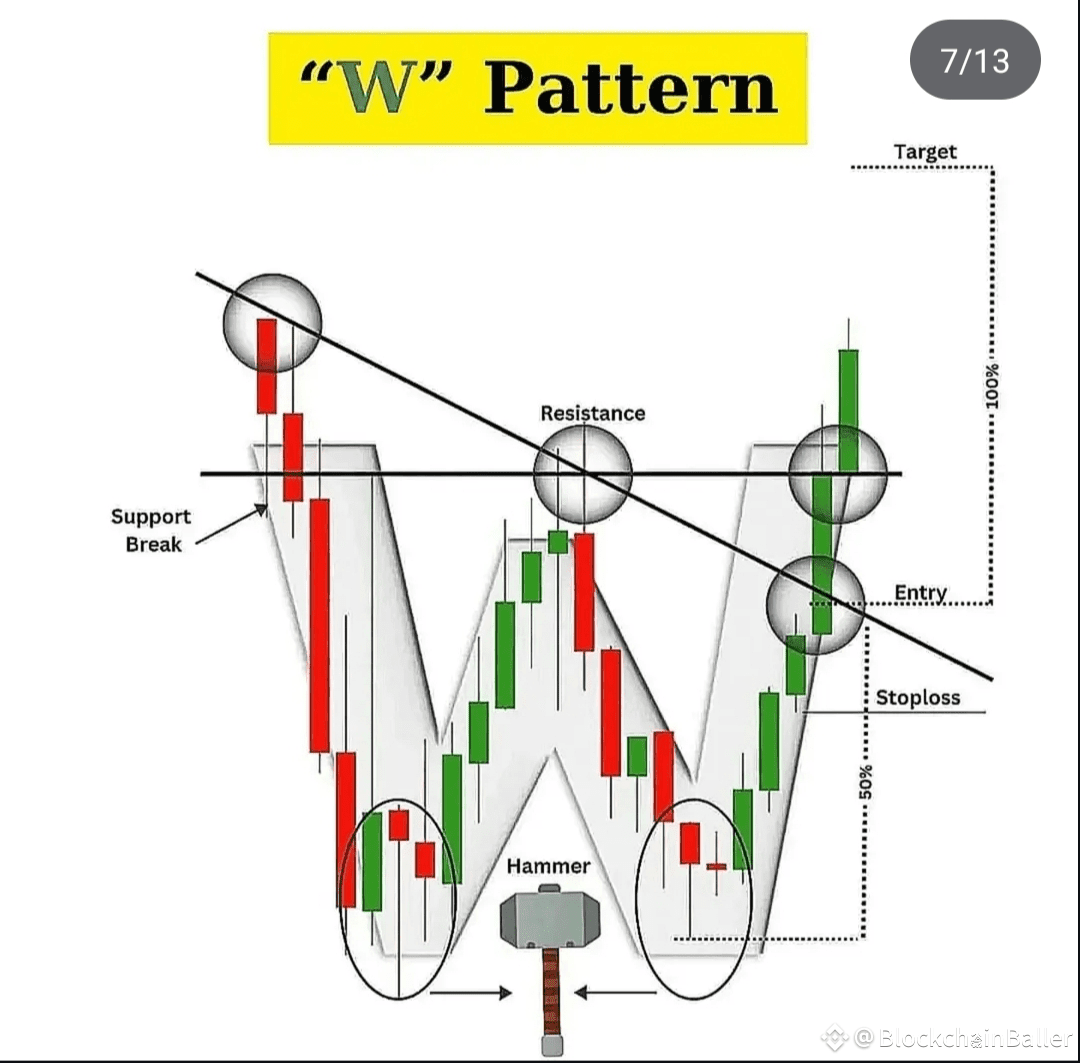
W PATTERN
W Pattern, also known as the Double Bottom, is a bullish reversal pattern that forms after a downtrend. It creates a “W” shape when the price hits a low, rebounds, drops again to form a second low, and then rises above resistance. A hammer candle often appears near the lows, signaling a potential reversal. Traders typically enter after the breakout above the resistance, setting a stop loss below the recent low, and target a full measured move from the breakout point.
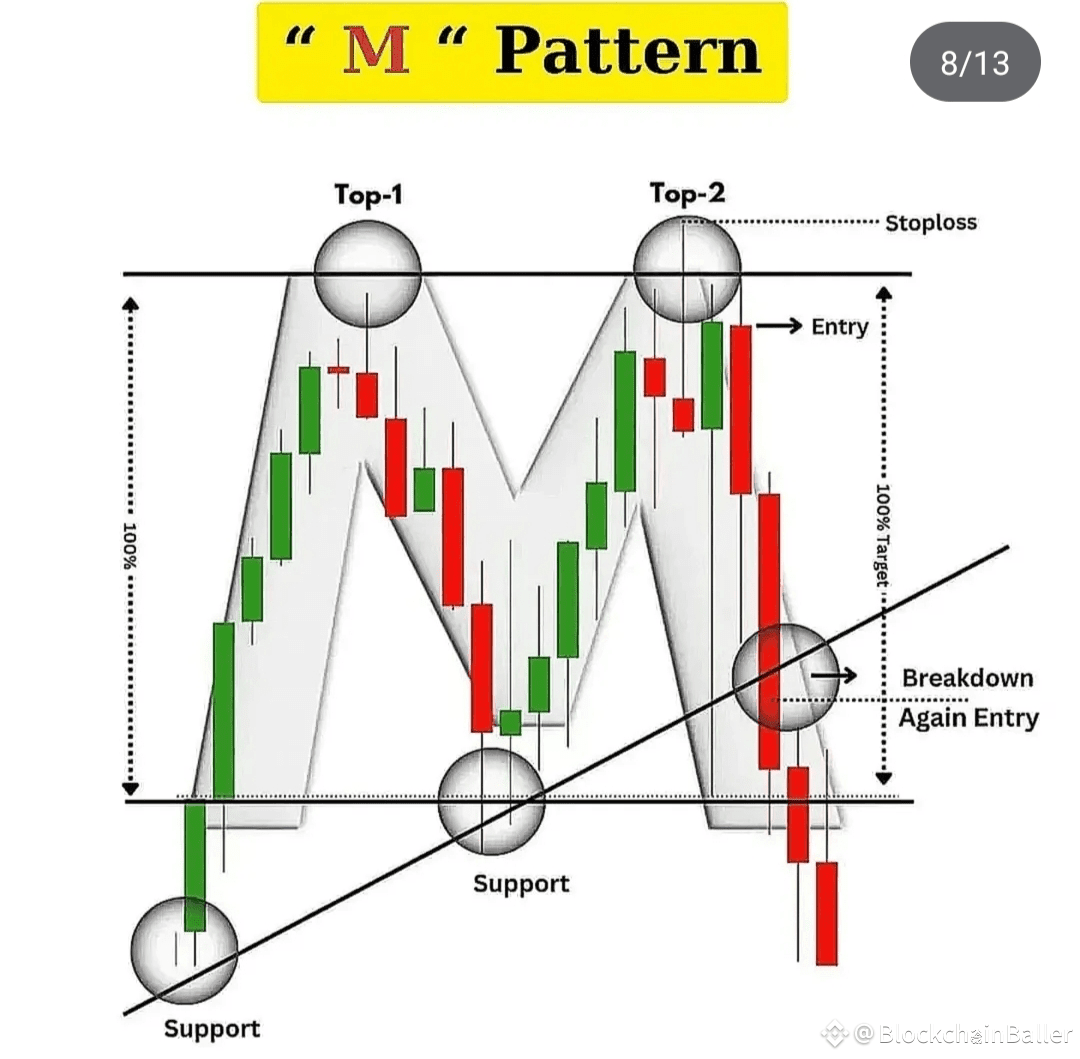
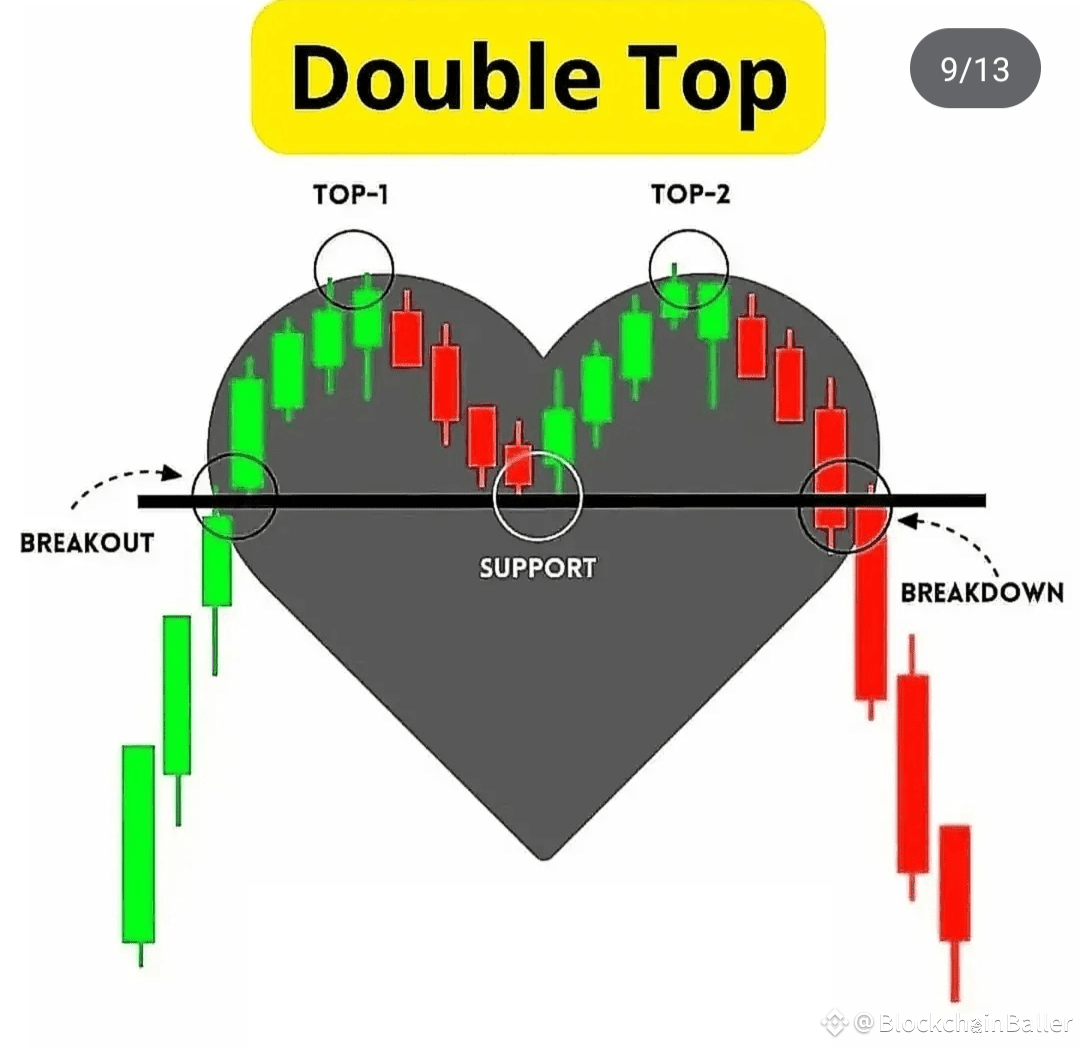
M PATTERN
M Pattern, or Double Top, is a bearish reversal pattern that forms after an uptrend. It occurs when the price hits a peak (Top-1), pulls back, rises again to a similar high (Top-2), but fails to break higher. When the price breaks below the support level formed between the two peaks, it confirms the pattern and signals a potential downtrend. Traders usually enter at the breakdown point, place a stop loss above Top-2, and target a price drop equal to the height of the pattern.
DOUBLE BOTTOM:
Double Top pattern is a bearish reversal signal that forms after an uptrend. It consists of two peaks (Top-1 and Top-2) at similar price levels, separated by a pullback to a support line. When the price fails to break above the second top and instead falls below the support level, it confirms the pattern. This breakdown indicates that sellers are taking control, and a further price decline is likely. Traders often enter a short position at the breakdown point, targeting a downward move equal to the distance between the tops and the support.
BULLISH HARAMI
Bullish Harami is a candlestick reversal pattern that signals a potential shift from a downtrend to an uptrend. It forms when a small green candle appears completely within the range of the previous larger red candle, resembling a pregnant figure. This pattern shows that selling pressure is weakening, and buyers are gaining control. Traders typically enter after the green candle forms, placing a stop loss below the recent low, and target higher price levels with a favorable risk-to-reward ratio.
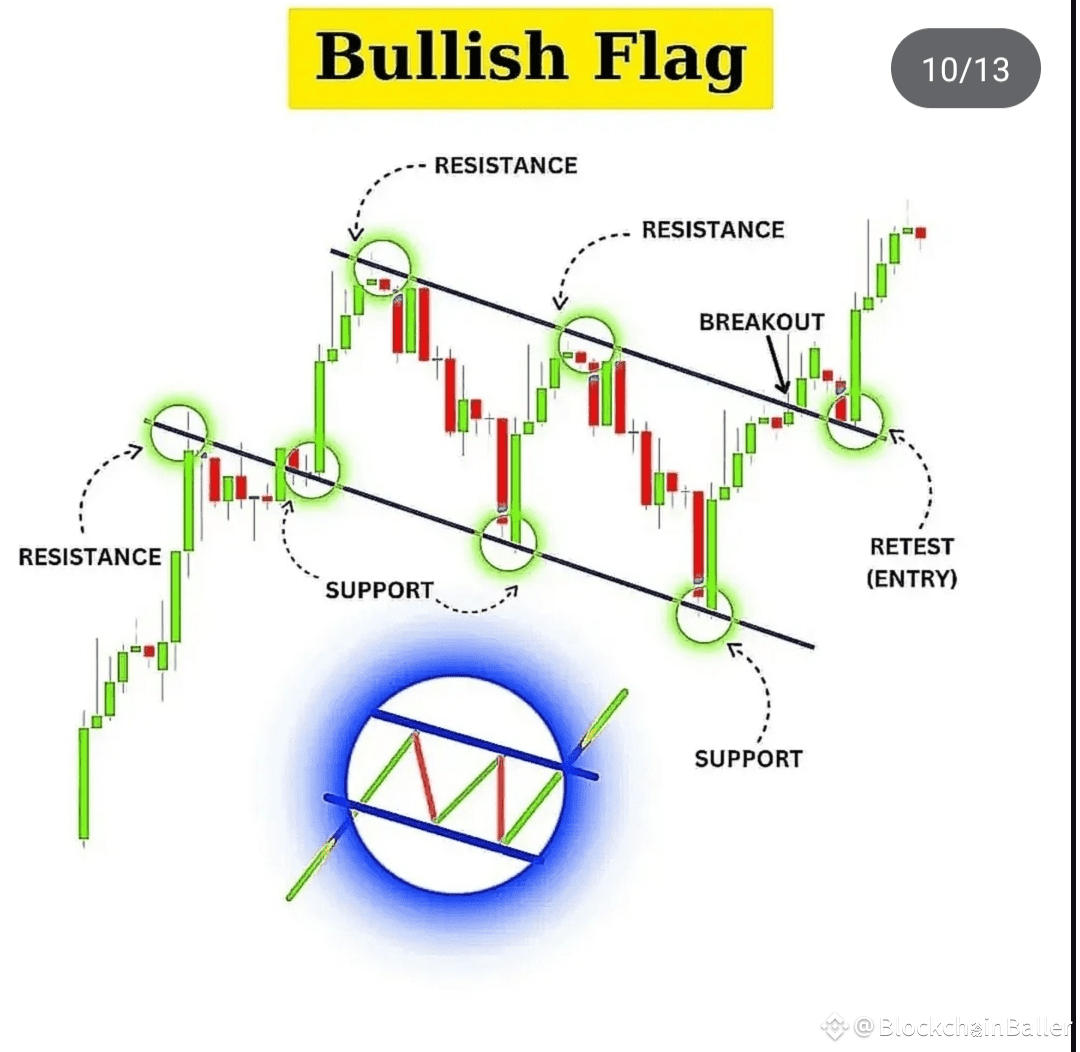
BULLISH FLAG :
Bullish Flag is a continuation pattern that appears after a strong upward move, followed by a downward-sloping channel resembling a flag. The price moves between resistance and support within this flag before eventually breaking out upward. A breakout above the resistance signals a continuation of the uptrend, and traders often enter after a retest of the breakout level. This pattern indicates that the market is pausing before resuming its bullish momentum.
Which of these patterns do you already use in your trading?
Comment below and let me know which one works best for you or which one you’ll try next...
Let’s level up together your next winning trade might just start here...
Drop your Suggestions below before next article 🤝🤝