chart analysis @lunyoner
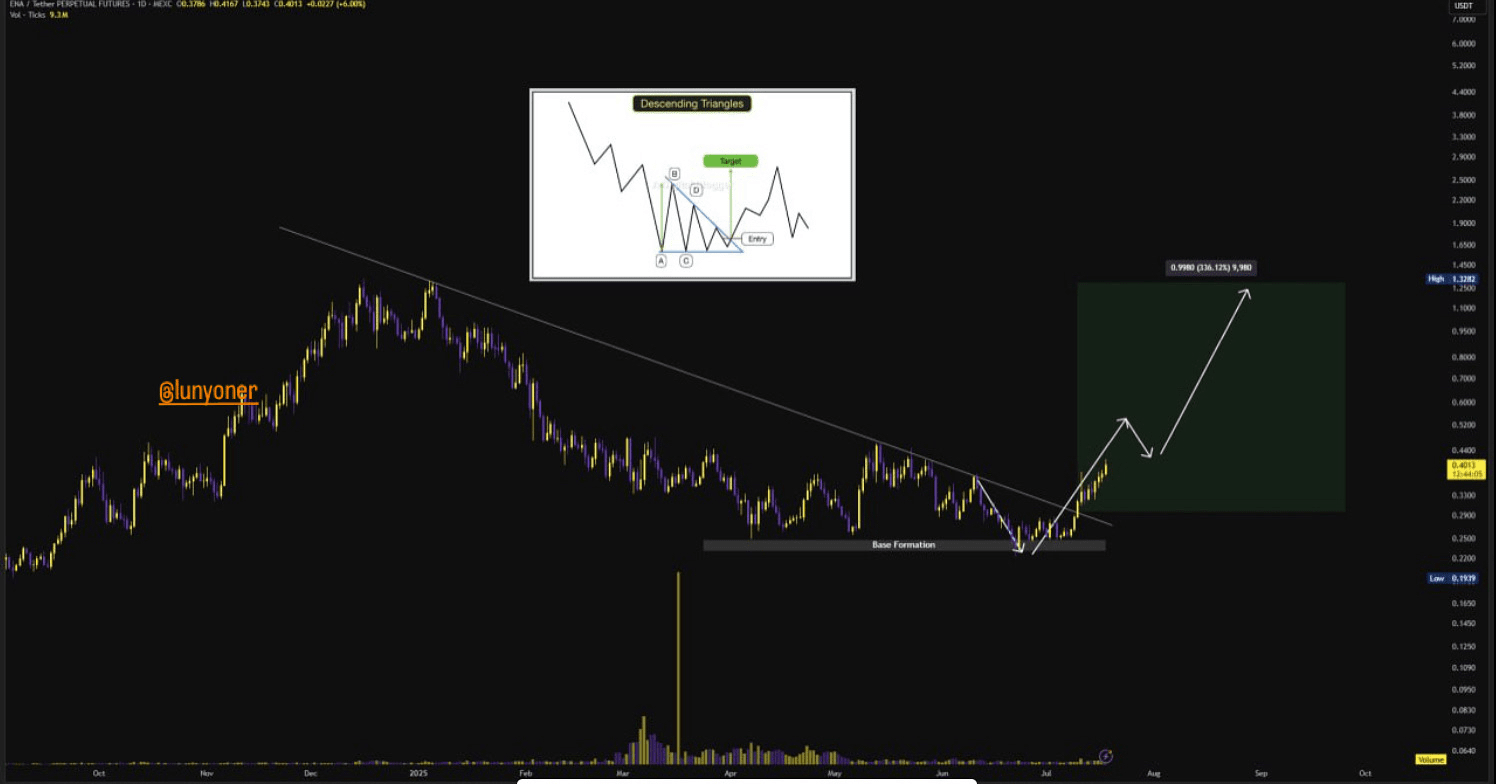
ENA/USDT 1D – Exit from Base Formation, Descending Wedge Breakout and Uptrend Journey
📊 Overall Outlook:
ENA has formed a 'base formation' after a strong downtrend on the daily chart. The descending trendline has been broken, and the uptrend has been confirmed with consecutive green candles. The chart shows a classic 'descending triangle breakout' followed by 'base test and continuation'.
🎯 Targets and Prices:
Current price: 0.4013 USDT
Short-term target: 0.60 – 0.75 USDT
Medium-term target: 0.99 USDT (major box target in the chart, up to 230% potential)
Long-term potential target: 1.25 – 1.50 USDT (previous peaks)
📍 Support – Resistance Levels:
Main support: 0.29 – 0.33 USDT (lower band of base formation)
Intermediate support: 0.36 – 0.38 USDT (previous breakout level)
Initial resistance: 0.47 – 0.50 USDT
Main resistance: 0.60 – 0.75 range
Major resistance: 0.99 – 1.25 range (previous peak)
📈 Trend Direction:
Daily trend: Turned positive – downtrend broken
4H: The uptrend structure is strong, pullbacks may occur with profit taking
1W: EMA’s are still below on the weekly, but momentum has turned upwards
📉 Indicators:
RSI (1D): Approaching the 65 level, entering the overbought zone
MACD: Positive crossover, momentum is just starting
OBV (volume flow): Increased in the breakout from the bottom
Volume: The breakout candle has been supported by very strong volume
📐 Formations and Reversals:
Base Formation: A safe accumulation area formed at the bottom
Descending Triangle Breakout: Directly transitioned to an uptrend after the breakout without retest
Higher Lows & Break: The confirmation of the breakout has been achieved with rising lows
🔍 Volume Analysis (4h – 1d – 1w):
4H: Volume explosions in uptrend segments
1D: 2-3 times volume increase on breakout days
1W: Although full confirmation has not yet come, the upward momentum is strong
🧭 Road Map – Possible Scenarios:
Scenario 1 – Ongoing Uptrend:
If the 0.47 resistance is broken, a strong rally may come to the 0.60-0.75 area
The 0.99 target is achievable (especially if BTC.D starts to drop)
Scenario 2 – Pullback & Continuation:
There may be a pullback to the 0.38 – 0.35 area, from which buyers may re-enter
Scenario 3 – Fakeout Risk:
If a daily close is made below 0.35, the formation may be invalidated
📌 What Should the Strategy Be?
Trade Plan:
Buying Zone:
Currently 0.40 – 0.43 is suitable
If there is a pullback, 0.36 – 0.38 is a safer entry
TP – Take Profit Levels:
TP1: 0.55
TP2: 0.75
TP3: 0.99
Stop Loss: Below 0.34 daily close
R/R ratio: Risk: 15% – Potential Gain: 230% → Strong opportunity
🔑 Trade Justification and Recommendation:
What should be traded?
Formation (descending triangle + base break)
Volume confirmation
Trend reversal structure
Expectation of BTC Dominance decrease with a possibility of positive divergence for altcoins
📌 Summary Comment:
@lunyoner indicates that ENA/USDT is showing a very strong breakout scenario from the bottom. Both technical formations and volume-supported breakouts offer medium-term potential up to 200%. However, patience should be exercised during pullbacks, and SL should be applied with discipline for formation invalidation.
The roadmap is clear: Formation broken → Targets 0.60 → 0.99 → 1.25
A strong position opportunity for investors planning trades based on this formation.

