Understand MACD indicator in one article! A must-read for beginners 🌟
📌 Composition of the MACD indicator
DIF Fast line: The difference between the 12-day exponential average and the 26-day exponential average.
DEA Slow line: 9-day moving average of DIF.
MACD red-green bar line: Reflects the change in strength between long and short, red bar turns green, bears dominate; green bar turns red, bulls dominate.
0 axis: Boundary line of long and short strength, above the 0 axis bulls dominate, below it bears dominate.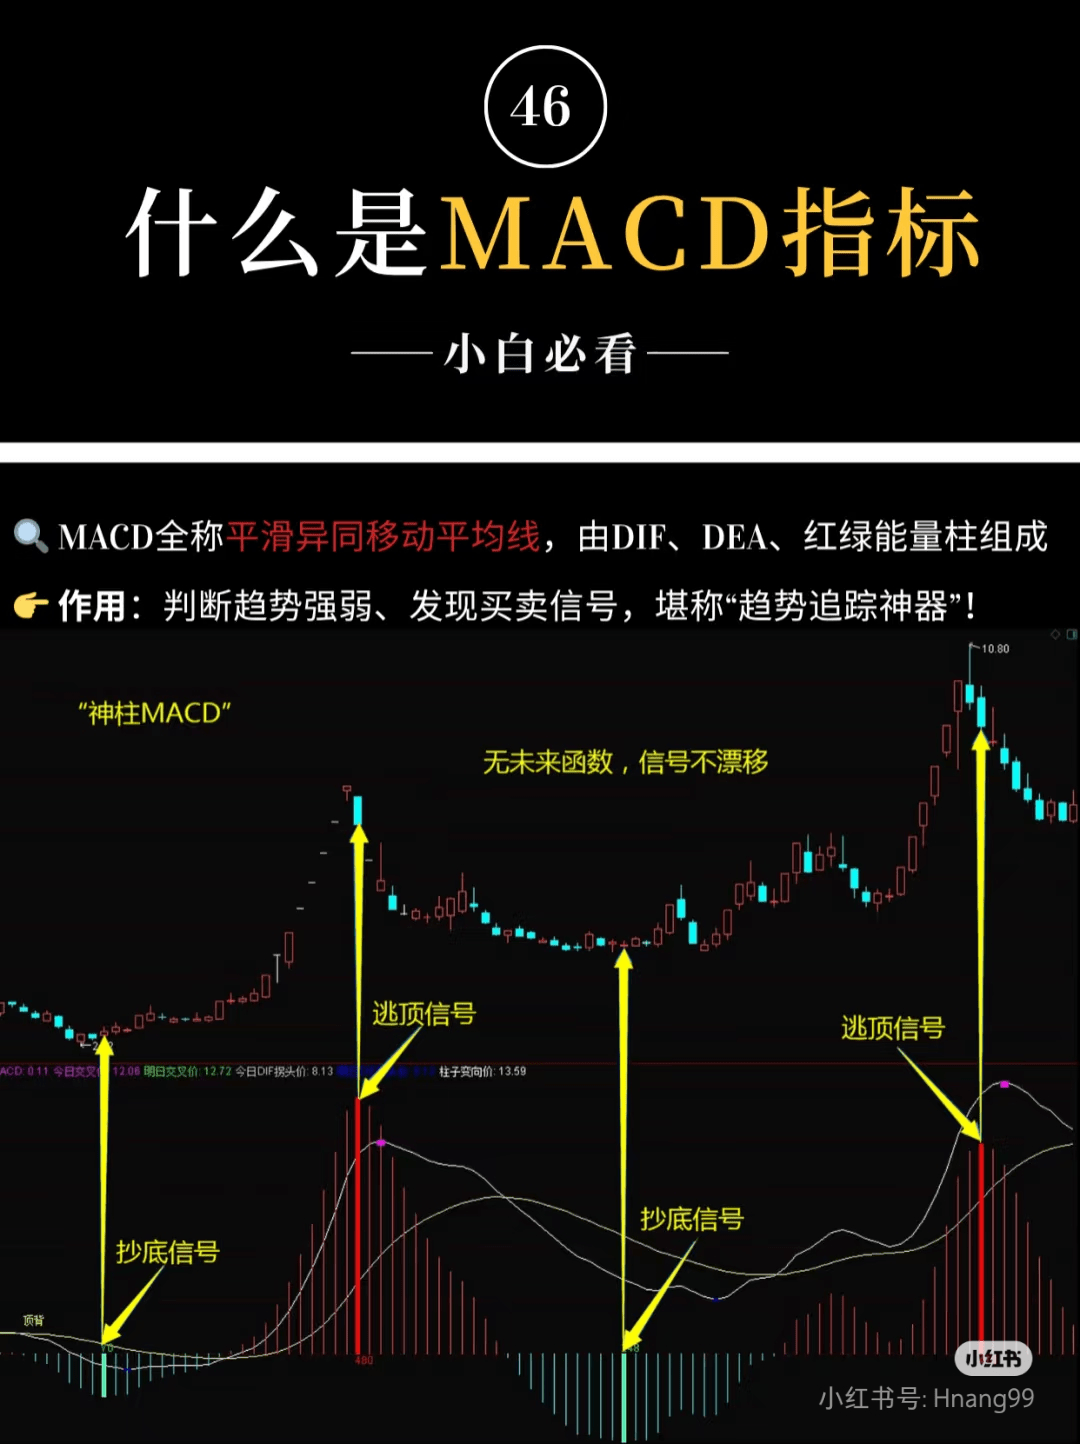
🌟 10 essential MACD mnemonics!
1️⃣ Zero axis determines long and short
Double line station at 0 axis → Bull market 📈 (Hold stocks for gains)
Double lines break below the 0 axis → Bear market 📉 (Run for your life)
0 axis is the boundary between bull and bear, long and short can be locked at a glance!
2️⃣ Golden cross underwater only rebounds, don't participate if it doesn't reach 0 axis
Golden cross below the axis = rebound during a decline, mostly a trap!
Wait until the double lines stabilize at the 0 axis before taking action, avoid bottom fishing and becoming a bag holder
3️⃣ Buy small, sell small, firmly grasp the turning points of long and short
Buy small: stock price falls, the wave after the green bar is shorter than the previous one → Bearish exhaustion, signal to bottom fish
Sell small: stock price rises, the wave after the red bar is shorter than the previous one → Bullish fatigue, signal to escape the top
Mnemonic: 'Big in front, small behind, golden cross to go; high in front, low behind, volume to run'
4️⃣ Divergence captures reversals, precise escape from tops and bottoms
Top divergence: stock price hits a new high 🔥, but MACD goes down → Quickly escape the top!
Bottom divergence: Stock price hits a new low 💧, but MACD rises → Prepare to bottom fish!
Top divergence accuracy > bottom divergence, especially reliable at weekly levels
5️⃣ On the verge of death must surge, if not gold must crash
Red bars shorten and suddenly lengthen (on the verge of death) → Main force's washout ends, main rising wave starts 🚀
Green bars shorten and then suddenly lengthen (whether it will be gold or not) → Downward continuation, quickly cut losses
6️⃣ High position shrinks, profits should be taken quickly
Stock price surges sharply + red bar suddenly shortens + far from 0 axis → Main force offloading, don't hesitate to take profits!
7️⃣ Low position golden cross, skyrocketing blooms
Stock price drops sharply + far from the 0 axis golden cross → Must rebound, if a second golden cross appears, the strength doubles 💥
8️⃣ Fire burns continuously, long bull market arrives
Red bars continue for >2 months → Sign of a big bull stock 🐮, hold on tight and don't get off!
9️⃣ Golden cross above water rides a rocket, death cross underwater jumps off a cliff
Golden cross above the 0 axis → Main rising wave starts 🚀
Death cross below 0 axis → Warning of a sharp drop ⚠️
🔟 Neither this nor that, a rebound is inevitable
After breaking 0 axis, the 3rd or 4th wave → Must rebound! Combine wave theory to catch short opportunities