Key Points:
The consolidation of Bitcoin seems likely to continue in the short term, as long as the price stays above $110,530, the trend remains positive.
The charts for BNB, XLM, LTC, and ETC all look optimistic.
Bitcoin ($118,239) remains in a consolidation phase as bears thwart the bulls' efforts to maintain a price above $120,000. Fidelity's Global Macro Director Jurrien Timmer states that Bitcoin's adoption rate is still in the middle of the curve compared to the internet adoption rate over the past few decades. This indicates that Bitcoin has more room for upward movement.
The rise of Bitcoin and the passage of three key legislations in the U.S. House have boosted market sentiment in the cryptocurrency industry. According to CoinMarketCap, this drove the total market cap of cryptocurrencies close to $4 trillion on Friday. Since then, the market cap has retreated to $3.85 trillion.
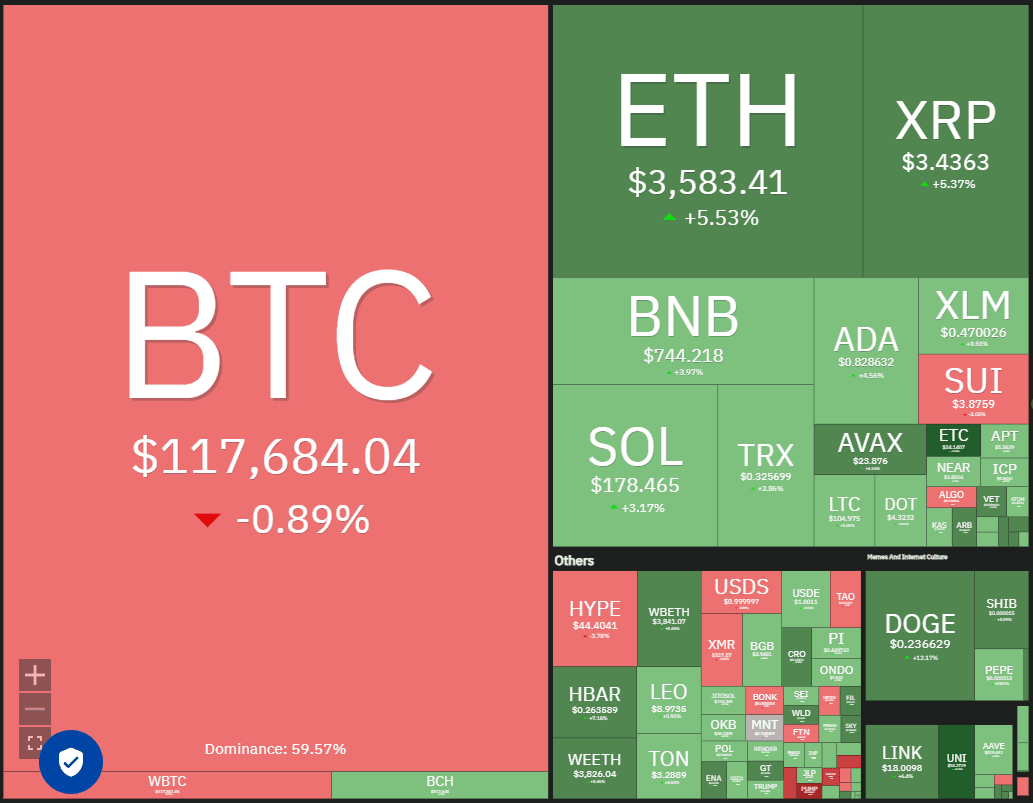
Ethereum ($3,577) leads the altcoins higher, signaling the start of an altcoin season. While significant increases are common during bull markets, traders should be prepared for frequent pullbacks during the upward process. Therefore, it is best to adhere to sound money management principles rather than blindly chasing prices.
Let's analyze the charts of five cryptocurrencies that look strong.
Bitcoin Price Prediction
A slight pullback in BTC indicates that bulls are not in a hurry to take profits, as they expect the upward trend to continue.
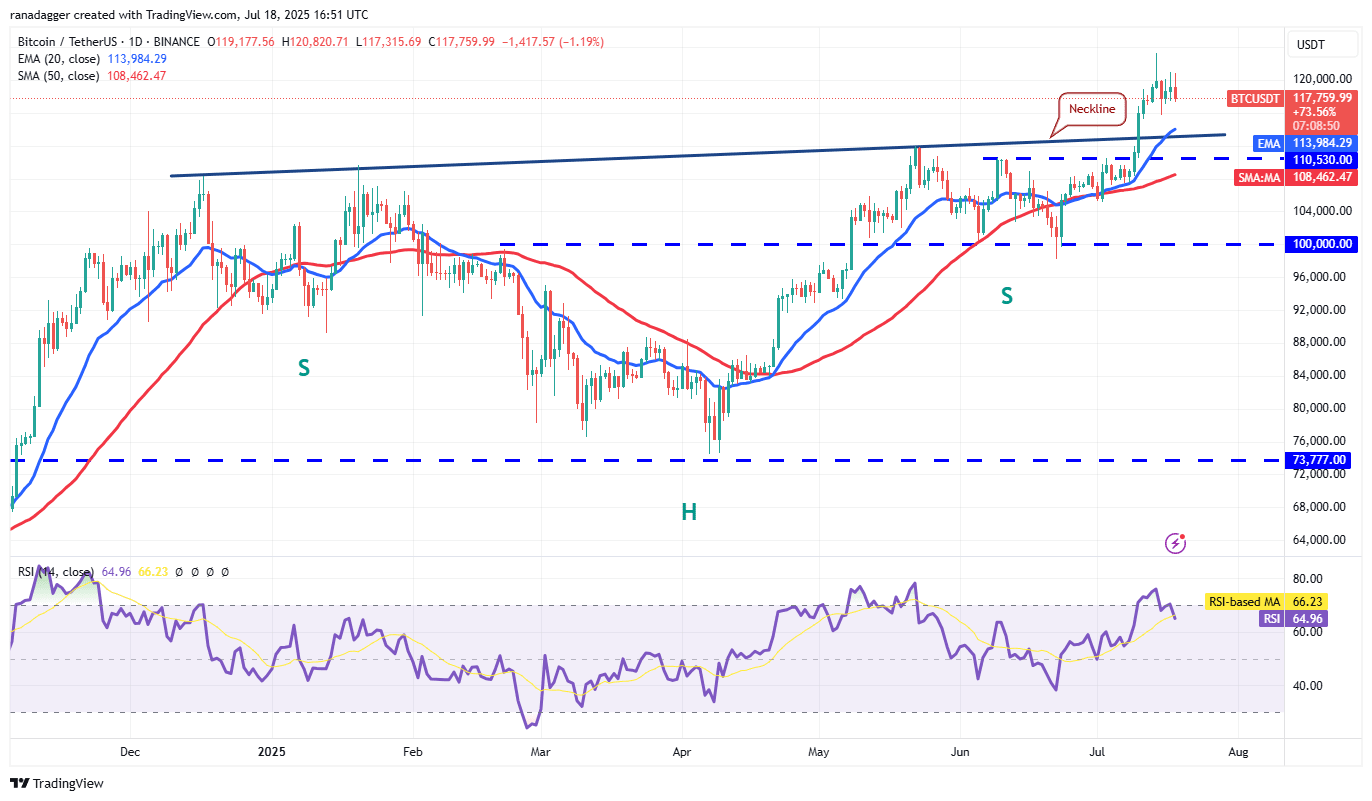
BTC/USDT Daily Chart. Source: Cointelegraph/TradingView
The 20-day Exponential Moving Average (EMA) is trending upward ($113,984), and the Relative Strength Index (RSI) is in the positive area, indicating that buyers have the advantage. If the bulls push the price above $123,218, the BTC/USDT currency pair may resume its upward trend. The currency pair could soar to $135,729 and then reach the target of $150,000.
The bears have little time left. They must quickly pull the price down below the support level of $110,530 to re-enter the market. This may tempt short-term traders to take profits, pushing the price up to $100,000.
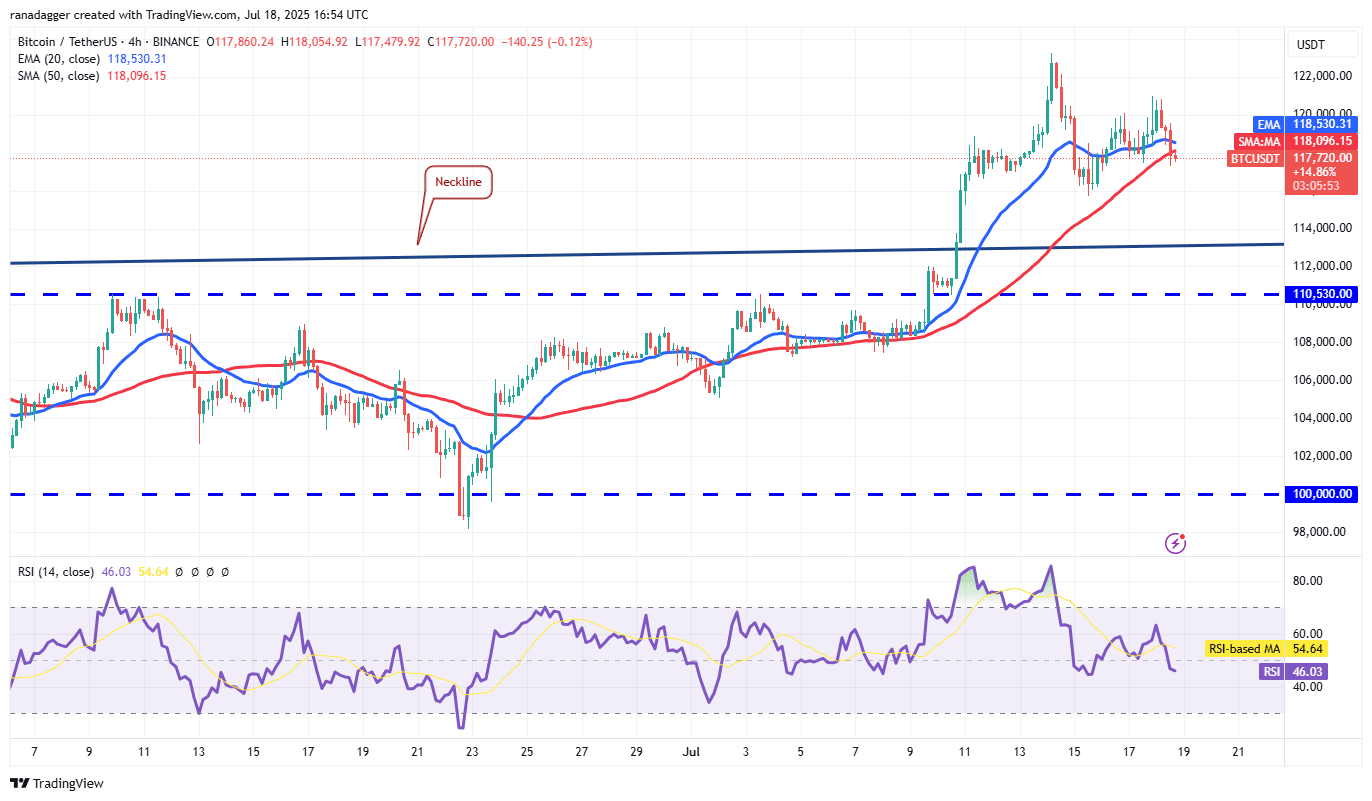
BTC/USDT 4 Hour Chart. Source: Cointelegraph/TradingView
The price has fallen below the 50-day Simple Moving Average (SMA), indicating that bulls are losing control. The currency pair may drop to $115,000, which is a key level that bulls must defend. If the bulls fail to hold this level, the currency pair may challenge the area between the head and shoulders pattern neck line and the support level of $110,530.
If the price rebounds from the support area, the bulls will attempt to break through $123,218 again. If successful, the currency pair may rise to $130,000 and then to $135,729.
BNB Price Prediction
Binance Coin ($734.10) gained momentum after breaking and closing above the resistance level of $698 on Wednesday.
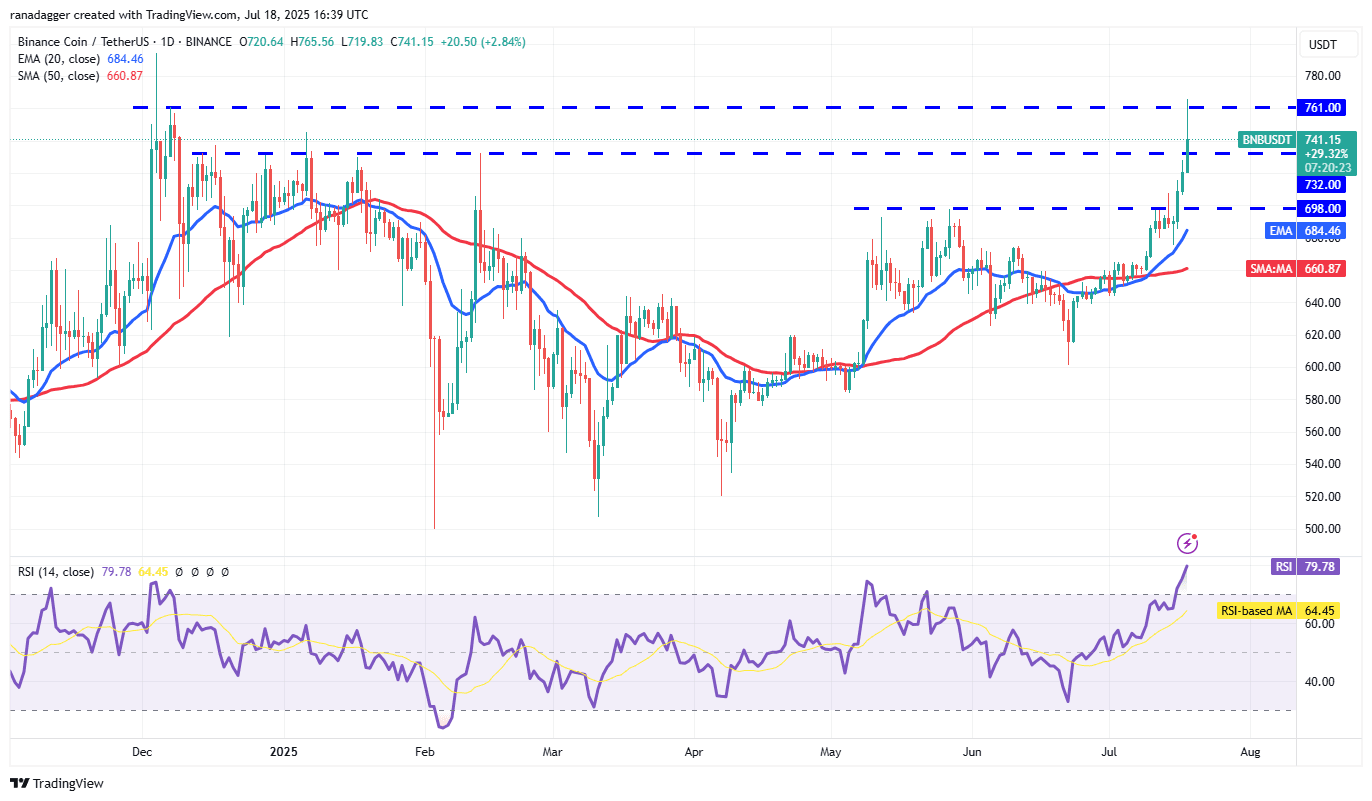
BNB/USDT Daily Chart. Source: Cointelegraph/TradingView
The BNB/USDT currency pair broke through the resistance level of $732 and hit $761 on Friday, with bears solidifying their defense. If buyers do not allow the price to fall below $732, it indicates optimistic market sentiment. This increases the possibility of breaking through $761. After that, the currency pair could soar to $794.
Conversely, if the price continues to decline and falls below $732, it suggests that a range-bound movement may form. The currency pair may fluctuate between $698 and $761 for a while.
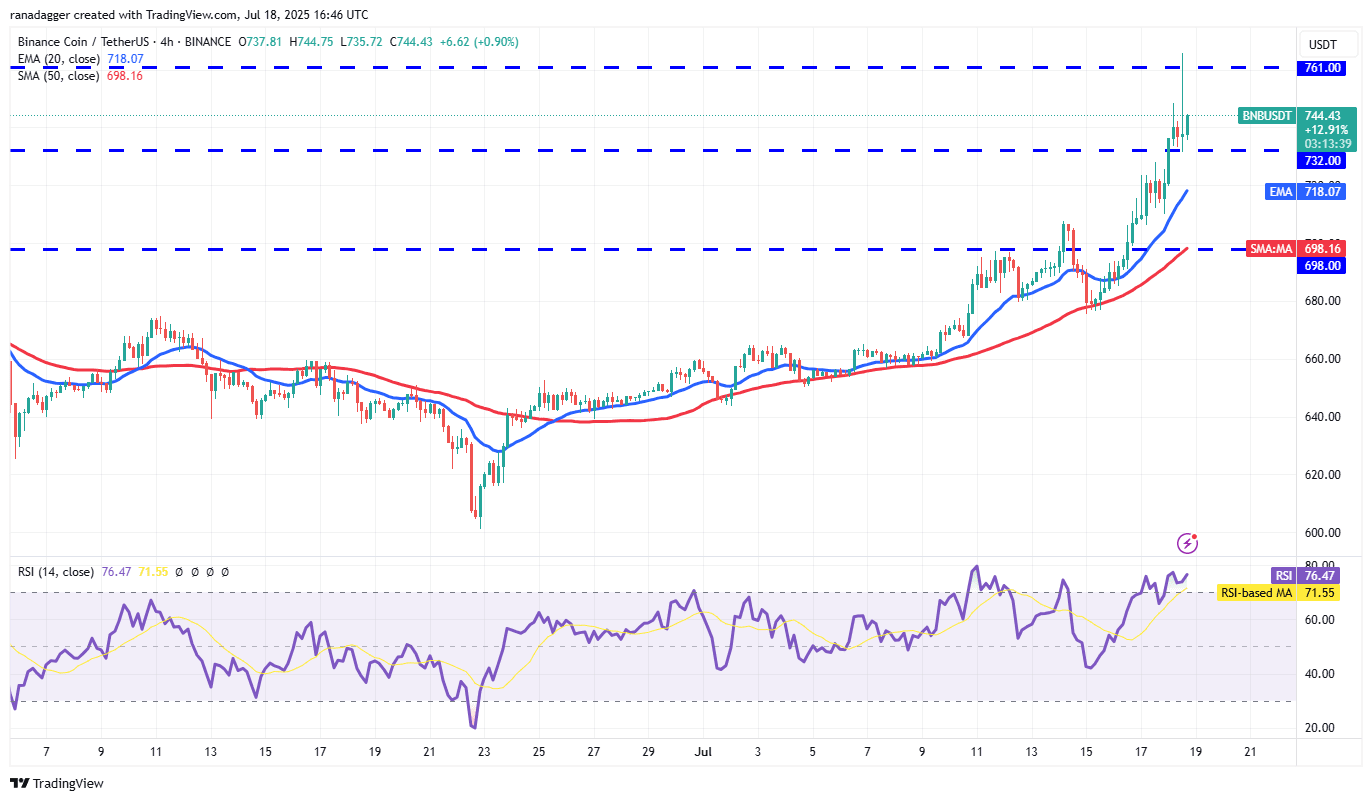
BNB/USDT 4 Hour Chart. Source: Cointelegraph/TradingView
Both moving averages are trending upwards, and the RSI is in the overbought zone on the 4-hour chart, indicating that bulls are in control. The currency pair pulled back from $765, but the positive signal is that bulls did not allow the price to fall below $732. Buyers will try again to push the currency pair up to $794.
The first sign of weakness would be a close below the level of $732; if the currency pair falls below the 20-EMA, the selling pressure may intensify.
Stellar Price Prediction
Stellar Star Shape Module has surged significantly to $0.4649 in recent days, reaching above the resistance level of $0.51.
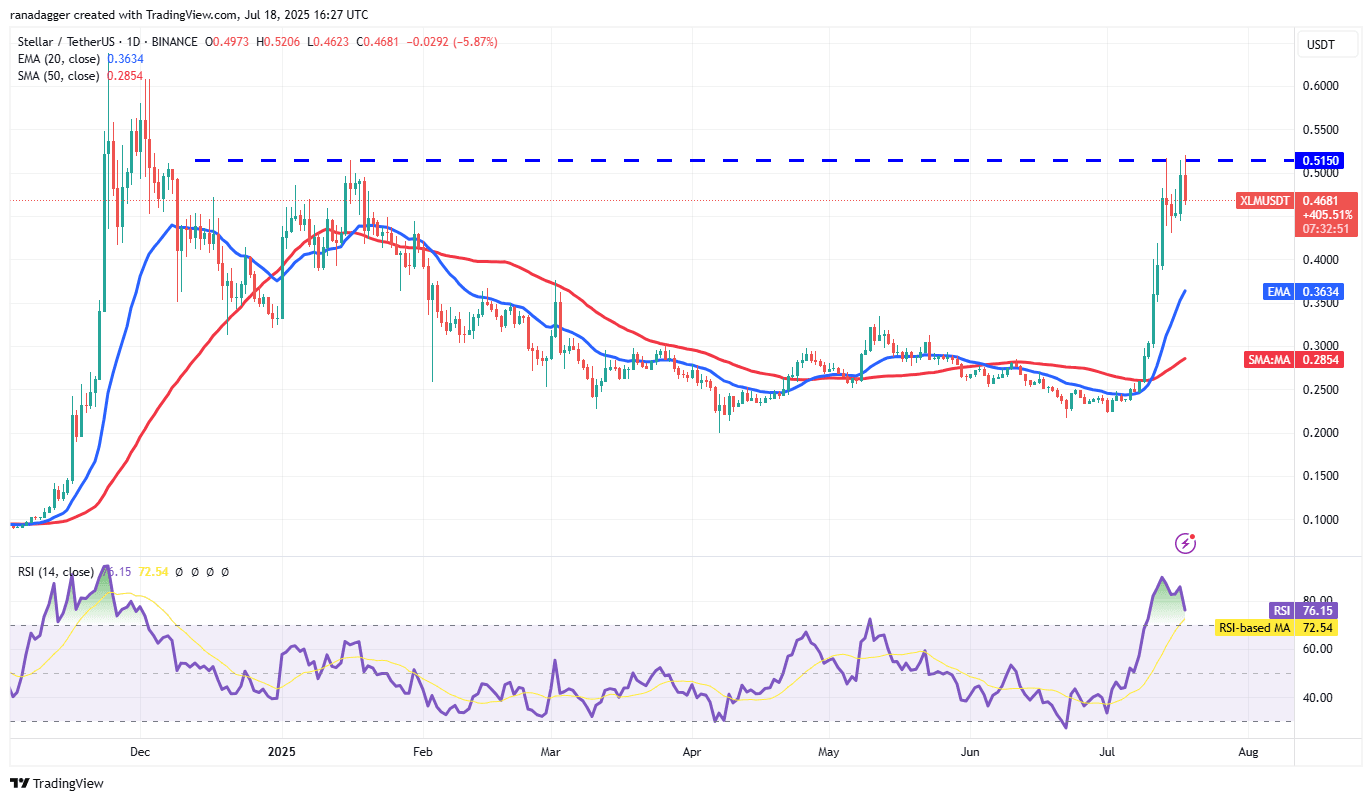
XLM/USDT Daily Chart. Source: Cointelegraph/TradingView
This round of increase has pushed the RSI into the overbought zone, indicating that there may be a consolidation or pullback in the short term. If buyers do not allow the price to fall below $0.43, the XLM/USDT currency pair may break through $0.51. If this happens, the currency pair may start the next round of upward trend, reaching a maximum of $0.64, and then may aim to break through the target of $0.80.
If the price falls and closes below $0.43, this positive outlook will be invalidated in the short term. The currency pair may subsequently drop to the 20-day moving average ($0.36).
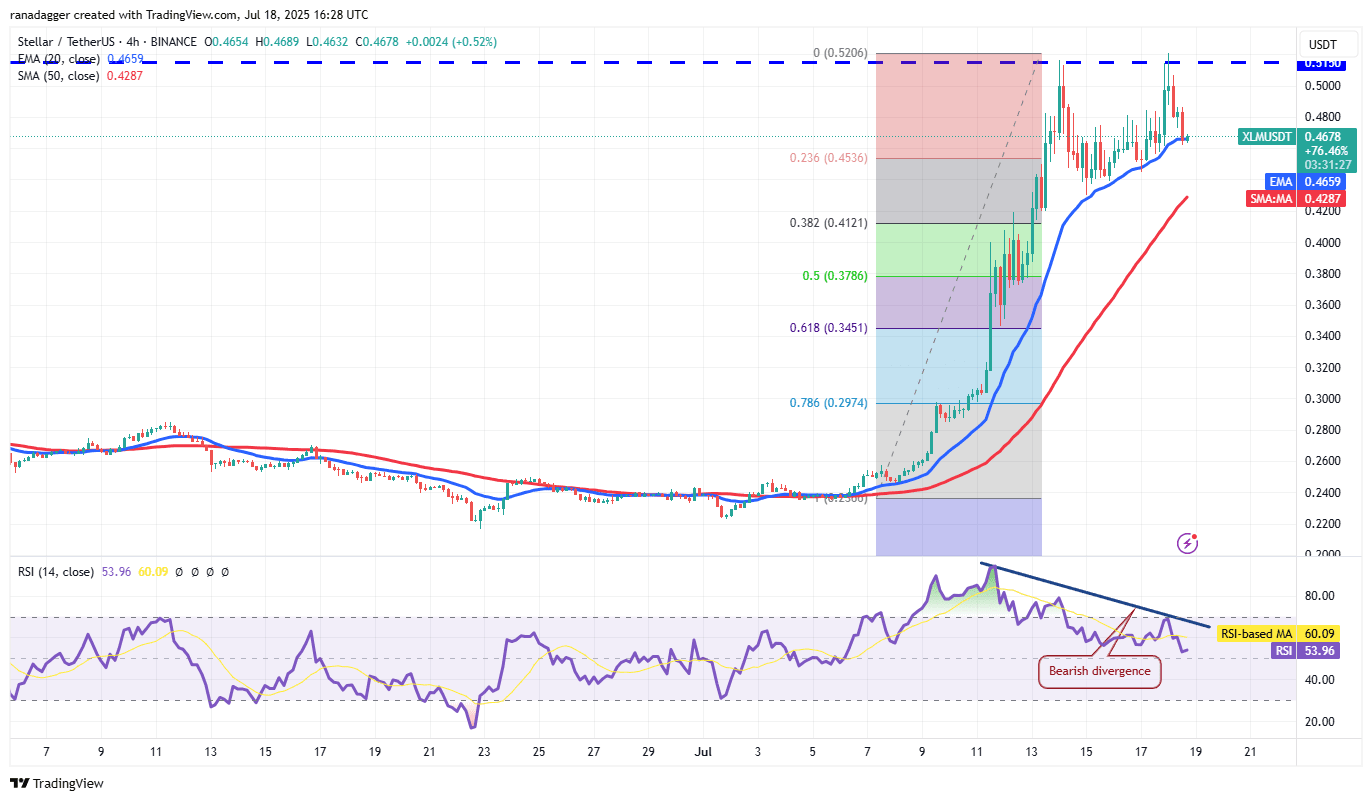
XLM/USDT 4 Hour Chart. Source: Cointelegraph/TradingView
The RSI on the 4-hour chart shows early signs of bearish divergence, indicating that momentum is weakening. If the 20-day moving average (EMA) breaks down, the currency pair may drop to the 50-day Simple Moving Average (SMA). This is an important level to watch closely, as a drop below the 50-day moving average may lead the currency pair down to the 50% Fibonacci retracement level of $0.37.
Alternatively, a strong rebound from the 20-day moving average suggests buying on dips. This increases the possibility of breaking through the resistance level of $0.51. The currency pair may then resume its upward trend to $0.59.
Litecoin Price Prediction
Litecoin at $102.66 broke through the resistance level of $107 on Friday, but the long wicks on the candlestick indicate that the bulls were unable to maintain higher levels.
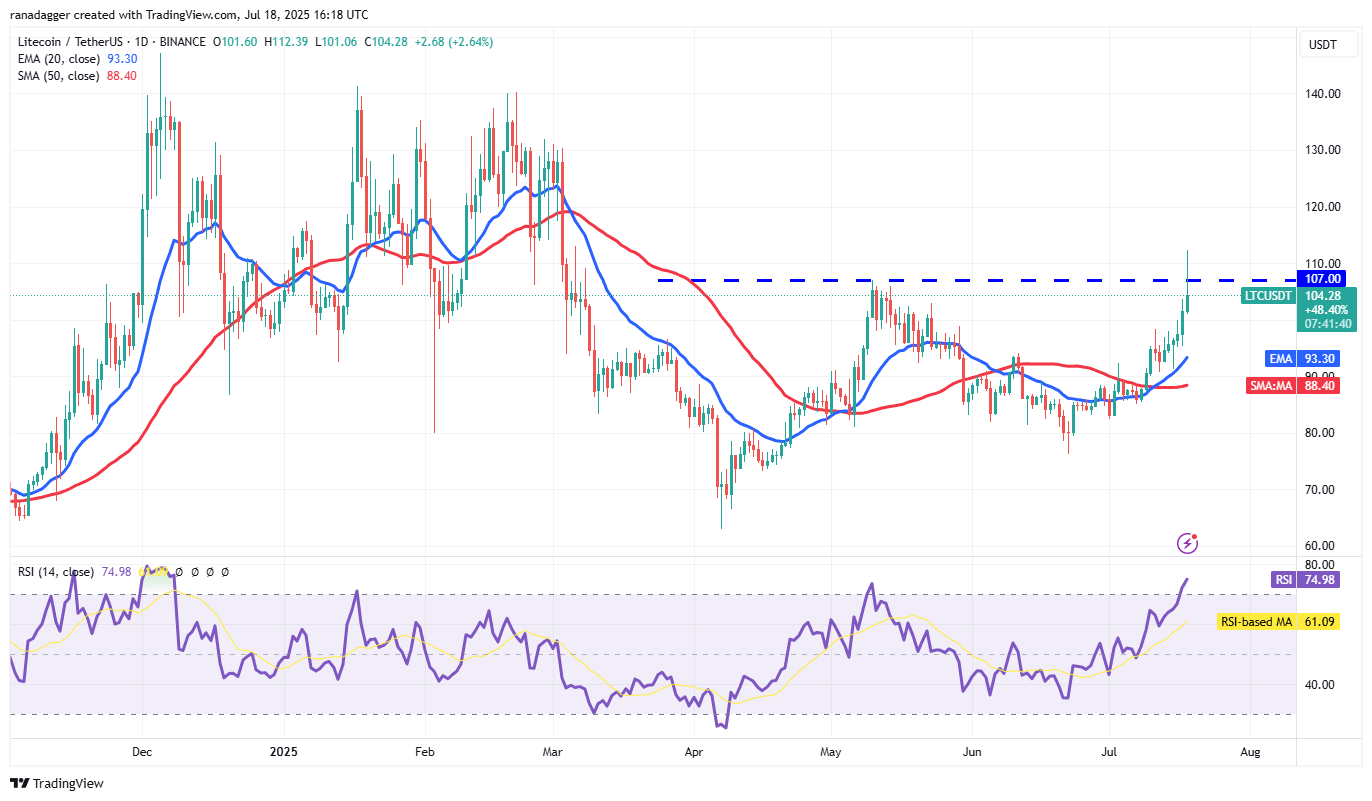
LTC/USDT Daily Chart. Source: Cointelegraph/TradingView
Bulls are unlikely to give up easily. They will try again to push the price and maintain it above $107. If they succeed, the LTC/USDT trading pair may soar to $130, then reach $140.
Sellers may have other plans. They will try to keep the price below $107. If they succeed, the currency pair may drop to the 20-day moving average ($93). Further pullback may delay the recovery of the upward momentum.
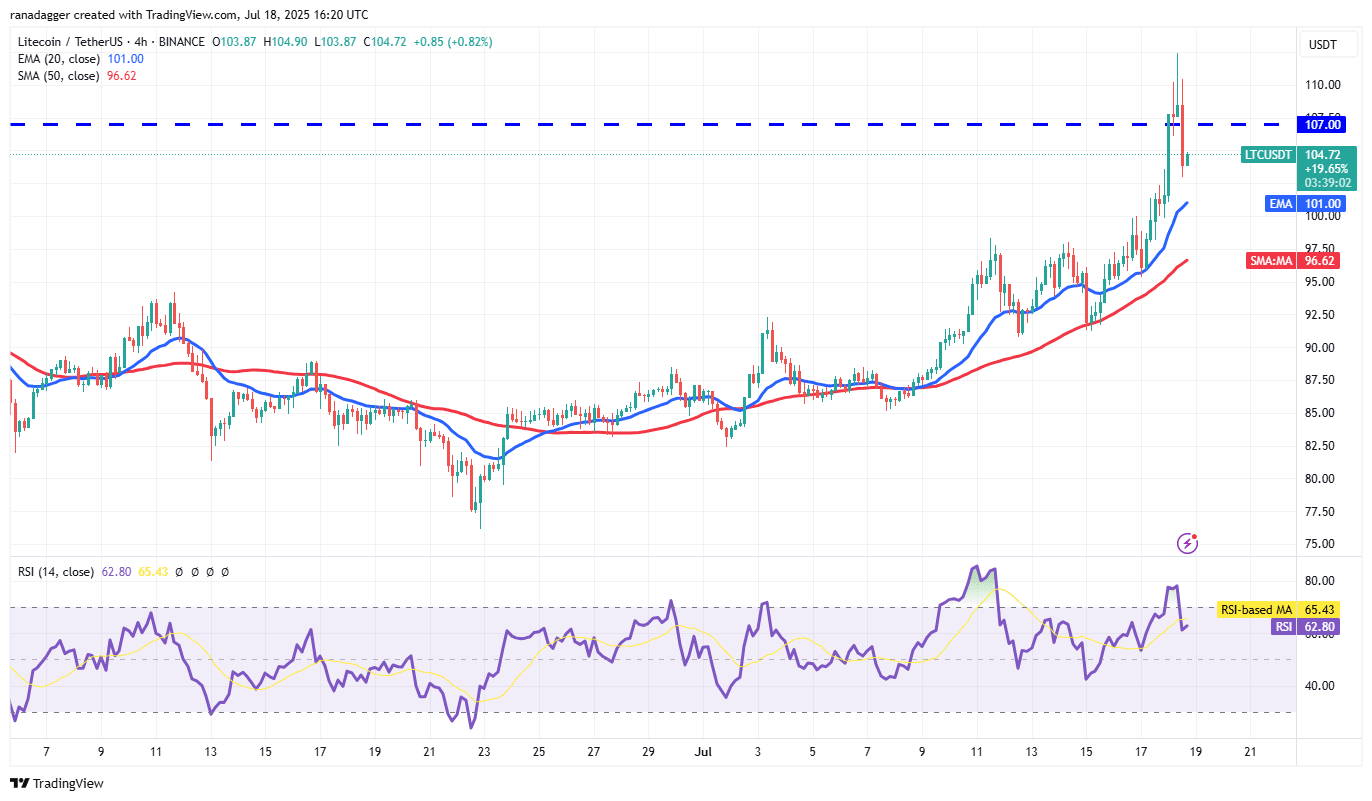
LTC/USDT 4 Hour Chart. Source: Cointelegraph/TradingView
Bears have pulled the price below $107, indicating strong selling pressure at higher levels. The currency pair may drop to the 20-day moving average, which is an important support level to watch. If the price strongly rebounds from the 20-day moving average, the bulls will try to push the currency pair to break through $112. If successful, the currency pair may rebound to $120 and then further rise to $130.
Conversely, a drop below the 20-day moving average indicates that short-term buyers are taking profits. This may lead the currency pair to fall to the 50-day moving average.
Ethereum Classic Price Prediction
Ethereum Classic ETC at $24.95 surged above the resistance level of $21.70 on Friday, indicating that the bulls are making a comeback.
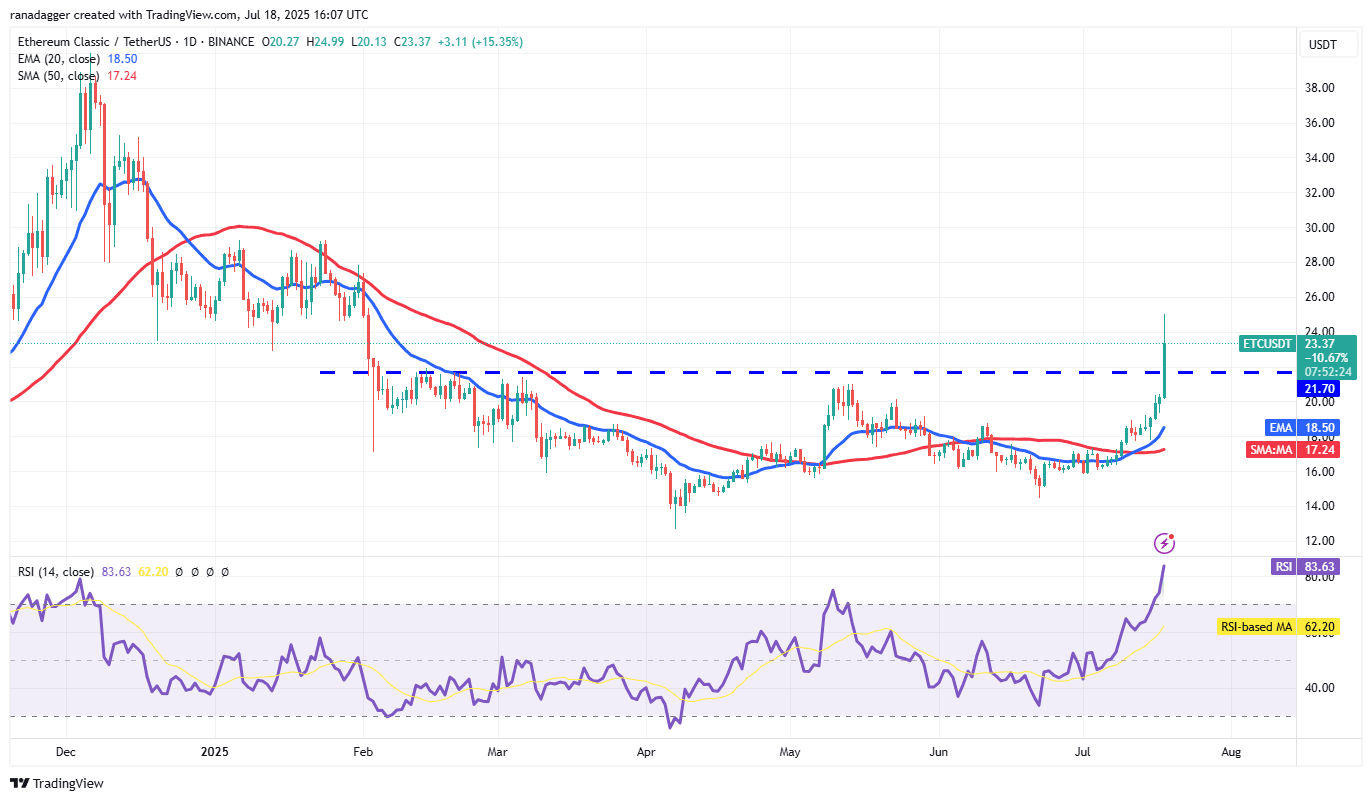
ETC/USDT Daily Chart. Source: Cointelegraph/TradingView
A strong rebound has pushed the RSI into the overbought zone, suggesting a slight consolidation or pullback in the short term. The ETC/USDT currency pair may retest the breakout level of $21.70. If the price strongly rebounds from the level of $21.70, it indicates that buyers have turned that level into support. This increases the likelihood of a rebound to $27.
Conversely, a drop below $21.70 indicates that the market is rejecting the breakout. The currency pair may subsequently fall to the 20-day moving average ($18.50).
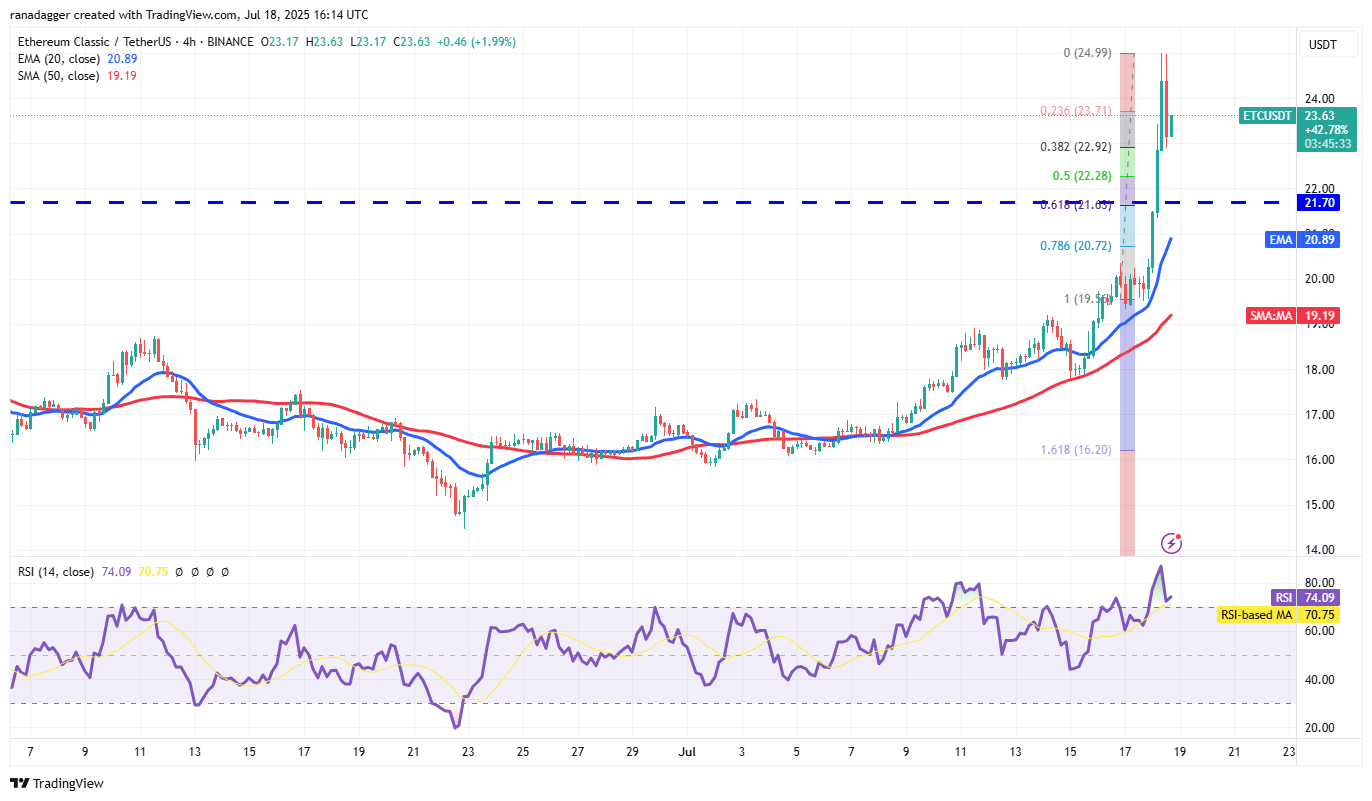
ETC/USDT 4 Hour Chart. Source: Cointelegraph/TradingView
This round of upward movement is facing profit-taking near $24.99, which has pushed the price to the 38.2% Fibonacci retracement level of $22.92. If the price rebounds from the current level, the bulls will attempt to restore the upward trend. If successful, the currency pair may rise to $27.
On the other hand, if it falls and closes below $22.92, the currency pair may drop to the key support level of $21.70. Buyers must firmly defend the $21.70 level to maintain bullish momentum. If efforts fail, the currency pair may drop to $19.56, completing a 100% retracement of the recent upward trend.
