📌 Key data from the chart:
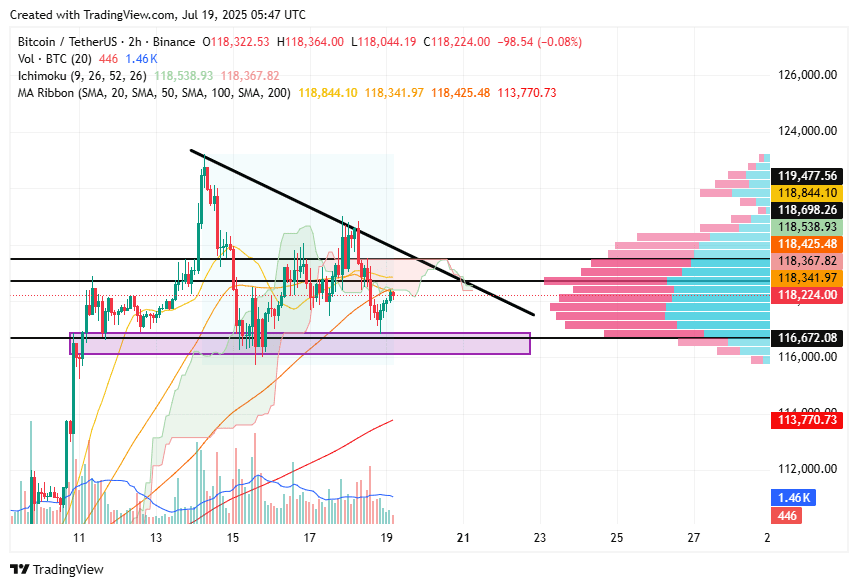
Price: $118,224
Formation: Descending triangle
Ichimoku cloud: Price below the cloud — this is a weakness signal.
MA Ribbons:
SMA 20 – 118,844.10
SMA 50 – 118,341.97
SMA 100 – 118,425.48
SMA 200 – 113,770.73
🔍 Technical Analysis:
📐 Formation:
The descending triangle indicates selling pressure. The upper boundary is the descending trendline (black), and the lower is the support zone around $116,672 (purple block).
☁️ Ichimoku:
The price is below the cloud — a bearish signal.
The Ichimoku cloud serves as dynamic resistance.
The cloud is narrowing, signaling a potential sharp move.
📊 Volume:
Volume is decreasing near the end of the triangle — characteristic before a breakout.
The point of maximum volume (Point of Control) by VPVR: $118,367.82 — this is key resistance.
📈 Support and resistance:
🔼 Resistances:
$118,341.97 (SMA 50)
$118,425.48 (SMA 100)
$118,538.93 (top of the Ichimoku cloud)
$118,844.10
$119,477.56 (top of the VPVR range)
🔽 Supports:
$118,000 – balance level
$116,672.08 – key support zone
$113,770.73 – SMA 200 — a global level of bullish interest
🧭 Scenarios for development:
✅ Bullish scenario (less likely at the moment):
A breakout of the descending trendline and a close above the Ichimoku cloud ($118,538.93). In this case, a rise to the zones of $118,844 and $119,477 can be expected.
❌ Bearish scenario (main):
A breakout of support at $116,672 will lead to accelerated decline to $113,770 and even a test of $112,000–$111,000. This activates the fulfillment of the descending triangle.
📌 Conclusion:
#Bitcoin continues to consolidate within a descending triangle, and the price is trading below the Ichimoku cloud, which maintains a bearish priority.
The market is waiting — the nearest breakout (up or down) will determine the next strong impulse. For now, the priority is with sellers.
📉 Watch for a breakout at $116,672 or $118,538 for confirmation of direction.
Be careful — the accumulation phase is nearing completion.