The market is not yet ready to give up, but the bear market may not leave it with a choice.

After experiencing a sharp rise and becoming one of the strongest-performing altcoins recently, XRP has now formed a typical 'shooting star' pattern on the daily chart, which is a common technical reversal signal often indicating a possible short-term pullback.
From the latest candlestick chart, after XRP reached a local high of approximately $3.70, a significant intraday pullback occurred, leaving a long upper shadow, while the body is small with almost no lower shadow, forming a standard shooting star structure.
This pattern often appears in high regions after a sustained rise. If followed by bearish candlesticks and increased selling volume, it is usually regarded as a bearish reversal signal, indicating a weakening of bullish momentum and the beginning of a bearish takeover in the market.
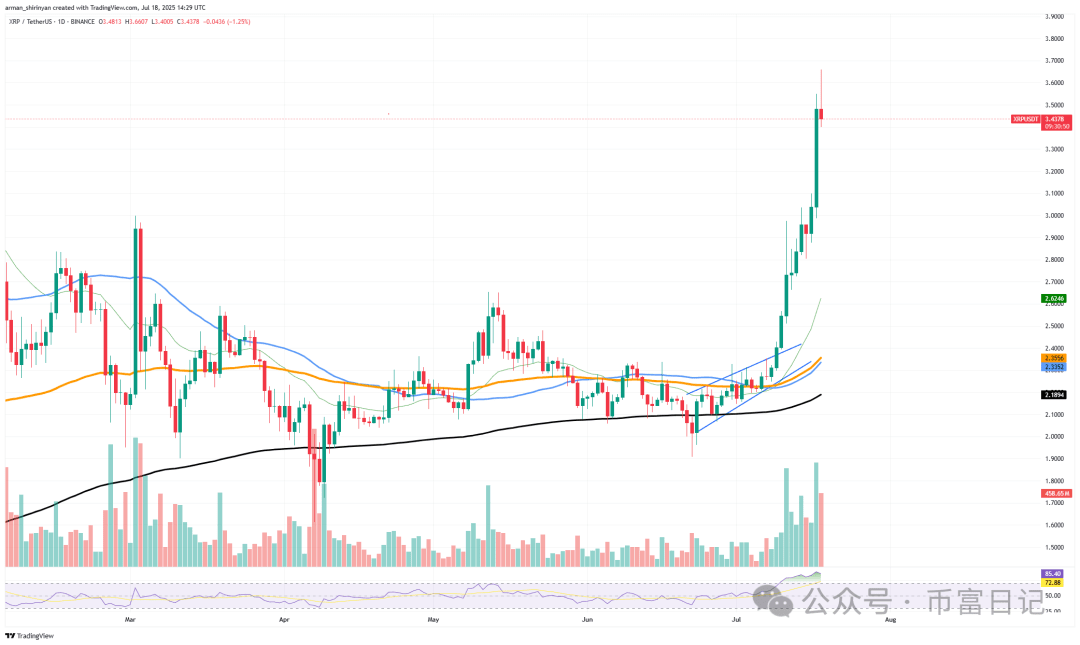
As selling pressure intensifies again, bulls are gradually losing dominance, showing that the market is struggling to maintain the previous high-intensity buying. As of the time of writing, XRP is quoted at approximately $3.49; although it has maintained a strong trend since the beginning of the week, the relative strength index (RSI) has risen above 88, indicating a severe overbought condition.
This means that the price may cool down or consolidate in the short term. Overall, XRP has significantly outperformed other mainstream L1 currencies in the past two weeks, with its surge primarily driven by institutional fund involvement and a spike in trading volume. However, due to a lack of solid fundamental support, it is difficult for speculative forces alone to drive sustained increases.
If the trend continues to show signs of retreat, the price may pull back to $3.20 or even test the $3.00 level. If the daily level 'shooting star' candlestick continues to evolve into a more obvious bearish pattern, XRP is likely to enter a consolidation or retracement cycle. At this point, bulls need to be cautious of losing key support to avoid deeper adjustments.
Ethereum rises.
Ethereum has surged above $3,600 and shows no immediate signs of weakening, creating an extremely fervent market wave. ETH is becoming the focal point of the current bull market in the cryptocurrency market, with a daily increase of up to 40.6% since April, yielding a return of over 150%.
Strong technical structures, continuously growing institutional capital inflows, and optimistic regulatory sentiment across the digital asset space all support this trend. The chart shows that ETH decisively broke through the psychological level of $3,000, confirming its support level, followed by an explosive rise.
After consolidating between $2,800 and $3,100 for a period, the trend accelerated and formed a clear breakout structure. The trading volume increased steadily alongside the price, which is a typical manifestation of positive momentum. Technical indicators are continuously breaking through their limits.
The current relative strength index (RSI) of Ethereum is about 85, which is in a severely overbought range. However, in a strong bull market, assets often maintain high levels of overbought status, especially against the backdrop of continuous large capital inflows. Ethereum's current trend reflects this characteristic.
For traders, three key technical levels need to be focused on: the psychological support at $3,000, the consolidation breakout area at $3,300, and the strong resistance level at $3,700 (which corresponds to the current top of the candlestick chart). If the price falls back to the $3,000–$3,300 range, it will be seen as an ideal buying opportunity in the mid to short term.
ETH's recent strong performance has clearly outpaced Bitcoin and other mainstream currencies, driven by the continually growing institutional funds, especially the strong interest in DeFi protocols and Layer-2 applications related to ETFs. Additionally, a more stable macro environment and gradually clearer regulatory situation have provided a solid foundation for Ethereum's upward movement.
Bitcoin is about to run out.
After a strong surge to $123,000, Bitcoin is currently showing signs of fatigue, with the price pulling back to the $118,000 range. Although Bitcoin remains in a macro uptrend, both market conditions and technical indicators suggest it may retrace to the $110,000 level, which is both possible and potentially healthy.
From a technical perspective, Bitcoin previously successfully broke through a symmetrical triangle pattern, confirming the continuation of the mid-term upward trend. However, two consecutive 'rejection' candlesticks have formed near the $123,000 area, indicating that buying momentum in that resistance zone is beginning to weaken, and signs of price stagnation are appearing. The current relative strength index (RSI) is about 68, still relatively strong but below the overbought range, suggesting that upward momentum is slowing.
The trading volume has also released similar signals. Although the breakout was accompanied by strong momentum, the trading volume of the subsequent daily candlesticks showed a downward trend, indicating that market demand is gradually weakening. If the price breaks below the current support range ($117,000 to $115,000), there is a risk of further retracement to $110,000, which previously acted as the upper edge of consolidation and may become a potential confirmation point for a pullback.
On-chain data shows that the number of open contracts in futures remains close to historical highs, reflecting a high level of market leverage usage, which indicates that the risk of liquidation is rising amid increased volatility. Additionally, the decline in financing rates also suggests that speculative enthusiasm is gradually cooling.
However, even if Bitcoin temporarily drops to $110,000, this adjustment still falls within a healthy range and does not signal a trend reversal.


