
Dogecoin has surpassed a key resistance zone this week, confirming an important technical setup. Analysts are now shifting their focus to $0.293 and $0.36 as potential next bullish targets. This breakout also coincides with news from institutions that could drive the long-term adoption of Dogecoin's price.
Dogecoin Surges After Breaking Trend Line
Analyst Ali stated that Dogecoin's price is heading towards a significant supply zone at $0.36. According to his chart, based on Glassnode's UTXO indicators, the highest actual trading volume currently lies below $0.20. As the price rises, the resistance level decreases due to the fewer coins being bought at higher prices in that area.
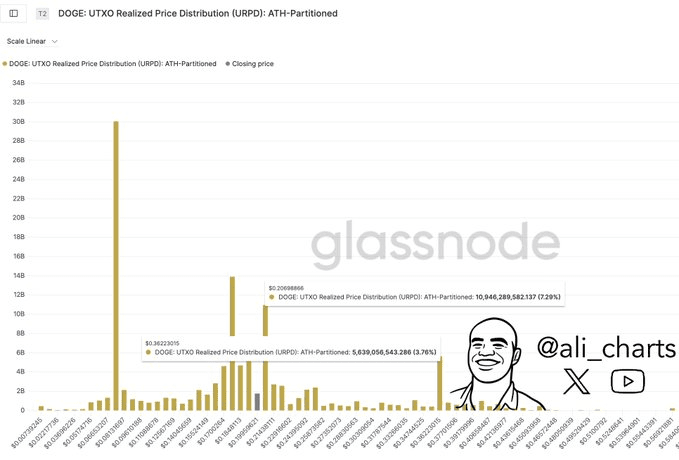
Analysis shows that the large-volume holder group ultimately lies within the $0.36 range. Surpassing this threshold, the supply line will flatten out, thereby reducing selling pressure. The price of DOGE may then shift to a higher trading range if buyers maintain control.
Previous resistance levels have been surpassed by the move above the $0.20 mark. On-chain volume distribution indicates that price exploration could accelerate beyond $0.30.
Dogecoin has risen 12% in the last 24 hours, trading at $0.2361 at the time of writing. Analysts now consider $0.293 to be the next technical resistance level, which could pave the way for a 50% increase to the target of $0.36.
Sell Wall at $0.293 Could Trigger Rapid Acceleration
Meanwhile, CW shared a sell chart showing that Dogecoin's price is approaching a key liquidity zone. In his analysis, he points out that the strong resistance level ultimately lies between $0.27 and $0.293. This zone has consistently acted as a ceiling for price rallies over the past year.
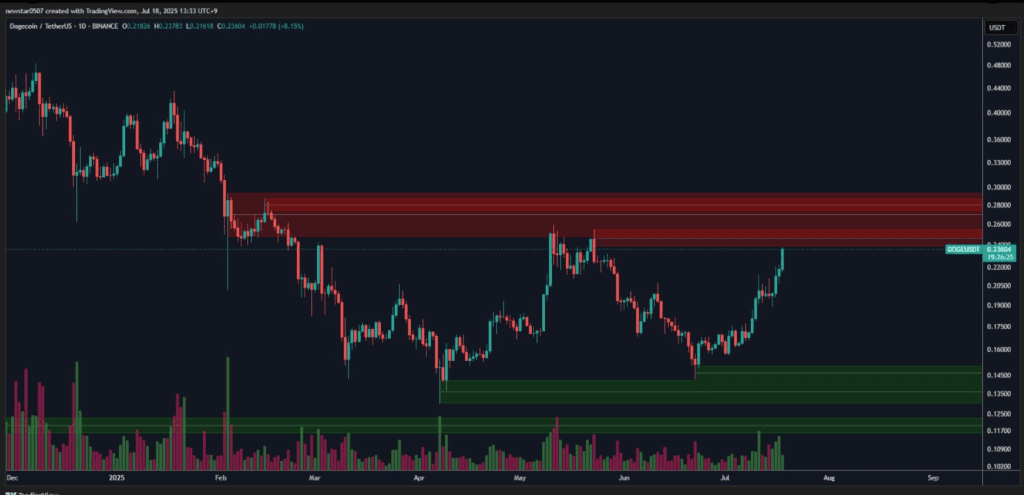
The chart shows red bars, illustrating dense sell orders stacked at this level. CW notes that if the price of Dogecoin surpasses $0.293, there will be no sell wall currently above. This would pave the way for a price surge to a new all-time high.
The volume chart confirms strong accumulation under the resistance level. If buyers continue to dominate, they could quickly break through the resistance. A daily close above $0.293 could significantly boost market sentiment.
Dogecoin Breaks Through 400-Day Trend Line
Furthermore, ZAYK Charts has identified a breakout on Dogecoin's 400-day descending resistance line. This move comes after a series of higher lows and a recent price increase above $0.22.
The price action of the meme coin currently shows a potential increase of 81% with a target of $0.43. The chart indicates the distribution of long-term compression, which helps strengthen bullish momentum.
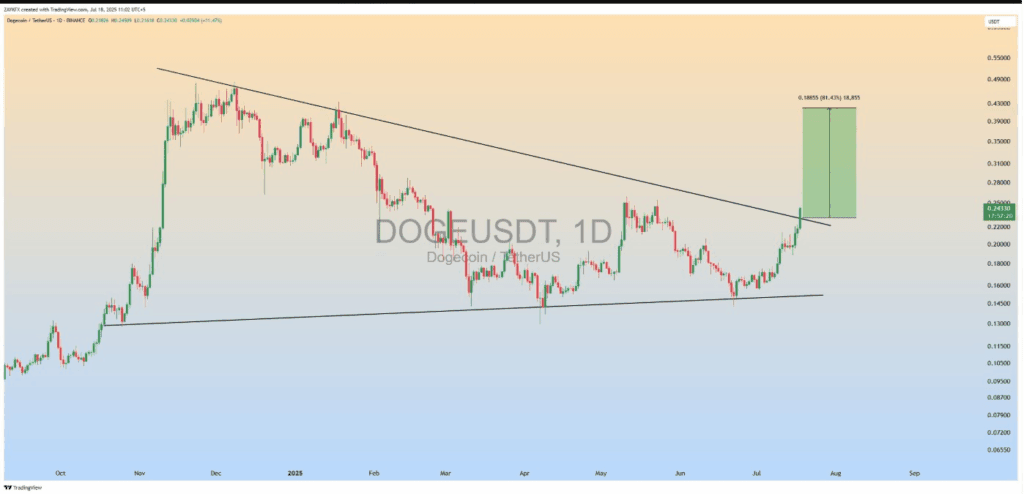
Furthermore, the breakout price range for DOGE is between $0.22 and $0.25. The analyst's forecast suggests that the upward momentum may continue, provided the buyers maintain the new support level of $0.22. The RSI indicator is not yet in the overbought territory, meaning there is still plenty of upside potential.
Dogecoin Treasury Plan from Bit Origin
In another recent development, Bit Origin (NASDAQ: BTOG) announced plans to acquire $500 million worth of Dogecoin. This US-listed company intends to issue $400 million in stocks and $100 million in convertible bonds. This will make Bit Origin the first public company to add Dogecoin to its treasury.
This move has reinforced long-standing confidence in the legitimacy of Dogecoin as a reserve asset. Although the current stance on the buyback is still pending, the market has reacted positively.
Meanwhile, Bit Origin's announcement comes at a time when technical charts are shifting towards a bullish trend. The breakout of DOGE's price, combined with institutional support, signals an upcoming bullish phase for this meme coin. If both trends continue, Dogecoin's price could extend its rally above $0.36 in the coming weeks.