Whales stirring up the market, policies opening the floodgates, ETH's golden train is arriving—do you have a ticket or just standing on the platform?
Current position and state:
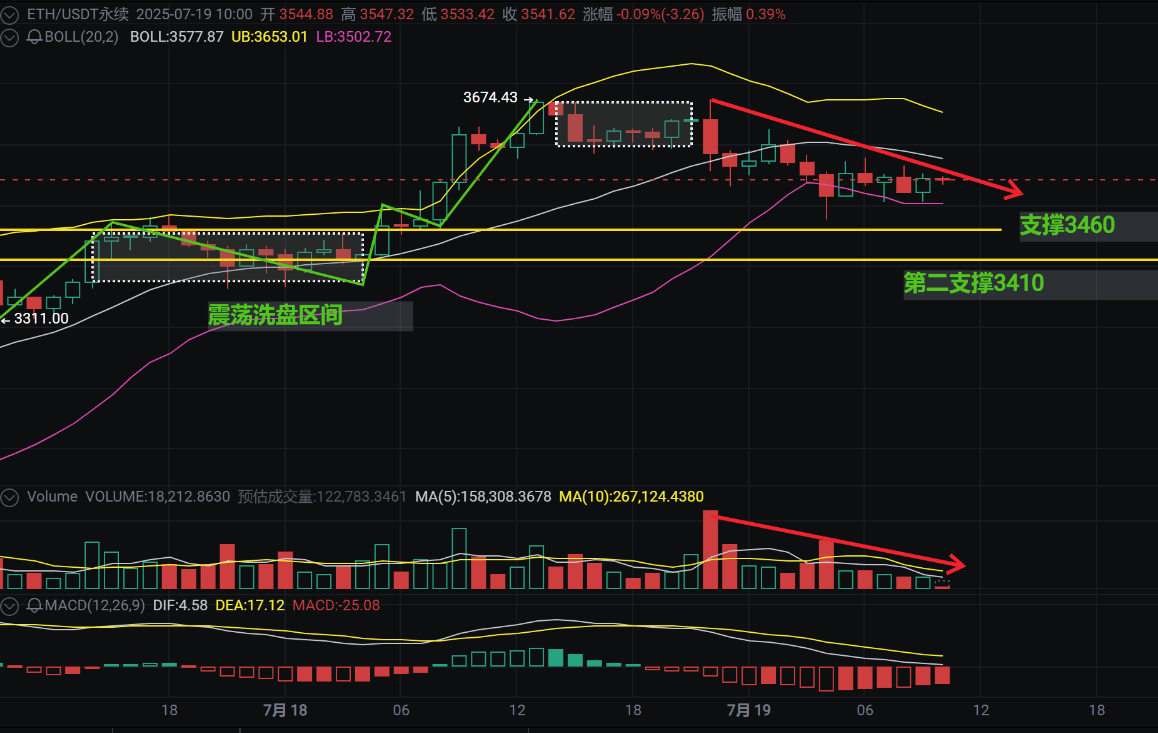
The price is currently hovering around $3540.
This position is below the middle line of the Bollinger Bands. Simply put, the middle line can be seen as a short-term 'average cost line'; if the price hovers below it, it indicates a weak short-term trend and insufficient buying power.
Bollinger Bands channel: The price is currently stuck in the lower half of the channel, closer to the lower band. This indicates that the downside potential seems larger than the upside potential.
How to interpret technical indicators:
MACD (-25.08): This green bar is negative and not small (-25). This clearly indicates that the momentum of the decline is still present, and there are currently no obvious signs of weakening. Both DIF and DEA are above the zero axis but moving downward, confirming a bearish short-term trend.
Volume: The current hourly trading volume (18,212) is far less than the 5-day average (158,308) and the 10-day average (267,124). This is critical! Low volume in a sideways or downtrend often indicates: either a continuation of the decline (taking a breather before potentially continuing down) or low market participation with unclear direction. Given that the price is currently on the weak side, the likelihood of a 'continuation of the decline' is greater.
Where are the supports and resistances:
Lower support:
First line of defense: Bollinger Bands lower band at 3502. This is the short-term support that needs to be monitored today. If it breaks down with increased volume, the short-term downside potential will be opened.
Second line of defense: 3410. This is a more important psychological and technical support level; if 3502 fails, this is where the bulls must hold.
Bottom line: 3311. This is a significant recent low point and the last line of defense; if it breaks below this level, the trend will be fundamentally damaged.
Upper resistance:
First hurdle: Bollinger Bands middle line at 3577. For the price to reverse the short-term weakness, it must increase volume and stay above this level.
Second hurdle: Bollinger Bands upper band at 3653. Only reaching this level can be considered a true short-term strengthening.
Strong resistance: 3674. This is a significant recent high point, and only breaking above this will open up larger upside potential.
Washing range: This annotation is very important! It suggests that the current price may be in a consolidation washing area. The main players may be using repeated oscillations here to force uncertain retail investors to give up their positions. In such a range, chasing up or down can easily lead to being trapped. It is necessary to patiently wait for a breakout of the range boundary (such as breaking above 3577 or below 3502) to confirm the direction.
Summary of today's ETH trend outlook:
Short-term weakness: The price is pressed below the key average line, and MACD shows that the downward momentum is still there, while the trading volume has shrunk significantly, indicating that buying power is weak and selling pressure has not been fully released. Bears temporarily hold an advantage.
Key focus on 3500: Today, the most crucial level to watch is $3500. If the price holds here and stabilizes or even rebounds slightly, there is still potential to watch. If it breaks down with increased volume, it will likely test the support at 3410.
Not easy to turn strong: To change this weak situation, we must see the price increase in volume and push back above 3577, preferably stabilizing above it. Otherwise, any rebound is just an opportunity for you to reduce positions or wait.
In the washing stage, don't move recklessly: It is likely that we are now oscillating back and forth within this range (for example, between 3500-3577). During such times, it is better to watch than act; don’t chase after a slight rise or panic sell after a small drop, as it is easy to get slapped in the face repeatedly. It is safer to wait for a clear direction (breakout with volume at key levels) before taking action.
Risk warning: Low-volume downtrends are the easiest to suddenly accelerate downwards. The low point at 3311 is the last line of defense; if it breaks, be very cautious.
Operational advice for ordinary investors:
Don't rush to bottom fish: The signals are unclear now, and the support hasn't been confirmed, so don't get itchy. If you really want to buy, wait for a strong volume to stabilize above 3577, or wait for the price to drop near 3410 with strong support signs (like a long lower shadow, strong rebound) before considering.
Be cautious if you have positions: If you have ETH, set a stop-loss (or alert) at 3500. If it breaks this level and doesn't quickly recover, consider reducing your position for risk avoidance. If it rebounds to the 3570-3577 area but can't break above, that is also a reference point for reducing positions.
Watch more and act less: The market is stagnant, and trading volume is low; during such times, holding back often earns more than acting. Patiently wait for the market to choose its direction (breakout with volume at key levels).
Keep a close eye on the news: News in the crypto world has a big impact; a sudden positive announcement could drive prices up, while negative news could break support levels. Maintain sensitivity to information.
In short, the outlook for today is: ETH is weakly oscillating within the range of 3500-3577 (bearish), with a key focus on whether the 3500 support holds. A drop below this level looks to 3410, while a breakout above 3577 could indicate a potential strengthening.
If you don't know what an effective breakout is, you can come to seek guidance; I will help you step by step. Are you trapped? When to bottom fish? As always, if you feel lost and helpless, just tap the profile picture to comment. I need followers, and you need references #GENIUS稳定币法案