Bitcoin continues to oscillate in the accumulation zone as the bears consistently hinder the bulls' efforts to maintain prices above the $120,000 threshold.
According to Mr. Jurrien Timmer – Global Macro Director at Fidelity – when compared to the pace of Internet adoption in previous decades, Bitcoin is currently in the middle of the adoption curve. This indicates that the growth potential of BTC is still very large in the long term.
Market sentiment in the cryptocurrency space is improving significantly, thanks to the uptrend of Bitcoin along with the recent passage of three important bills related to this sector by the US House of Representatives. Data from CoinMarketCap shows that the total crypto market capitalization approached the $4 trillion mark on Friday, before slightly adjusting to around $3.85 trillion.
Ether (ETH), currently trading around $3,550, is leading the recovery of the altcoin group – a clear signal that an “altcoin season” may be starting.
However, in the context of the market heating up, investors also need to be aware: short-term corrections are inevitable in an uptrend. Instead of chasing prices emotionally, adhering to sound capital management principles will be the key to surviving and succeeding.
Below is the technical analysis of five cryptocurrencies that are showing superior strength on the price chart.
Technical analysis of BTC
The slight correction of BTC shows that the bulls are not in a hurry to take profits, as they expect the uptrend to continue.
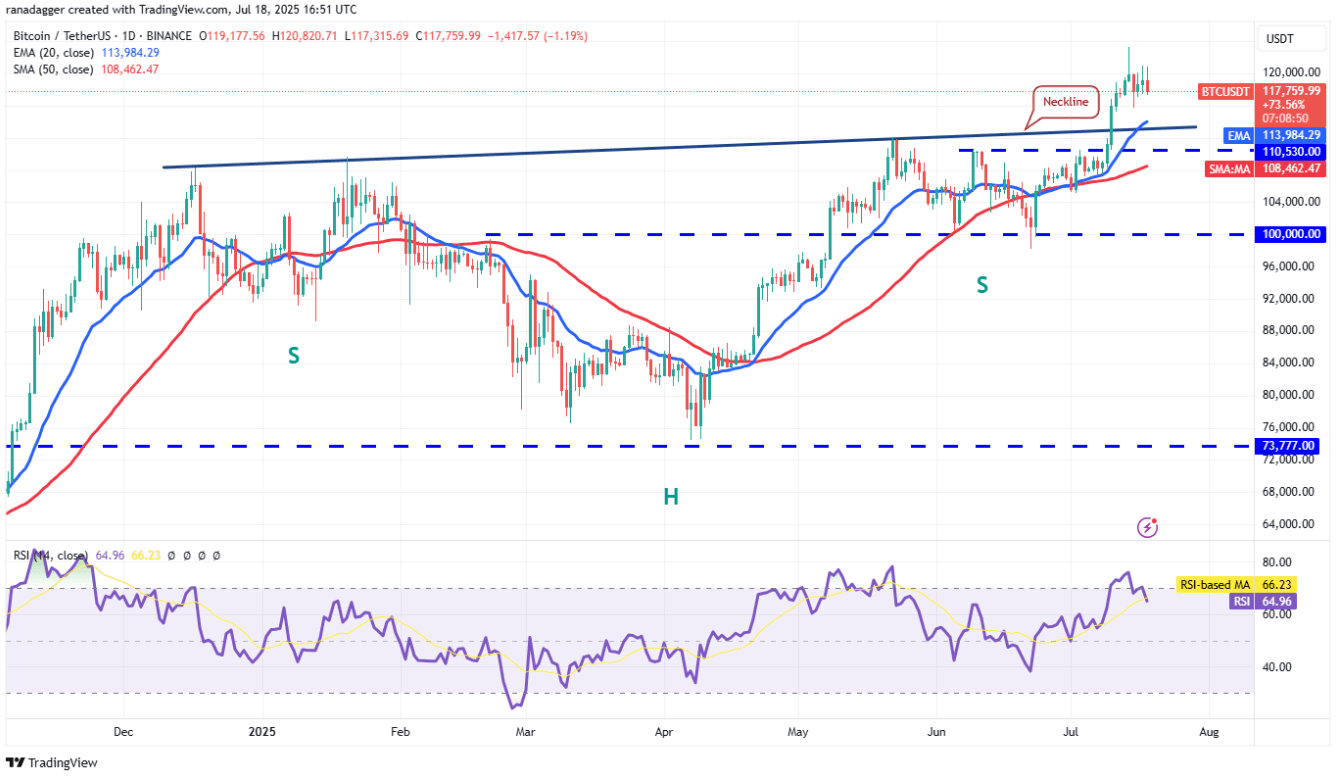
The 20-day EMA ($113,984) is rising along with the RSI indicator in the positive zone, indicating that the advantage still lies with the bulls. If they can push the price above the $123,218 threshold, the BTC/USDT pair could continue its trend, heading towards the $135,729 region, even the target according to the model at $150,000.
The bears are gradually running out of time to turn the tables. They will need to quickly pull the price below the $110,530 support level to regain the advantage. This could trigger short-term traders to take profits, pushing the price down to the $100,000 area.
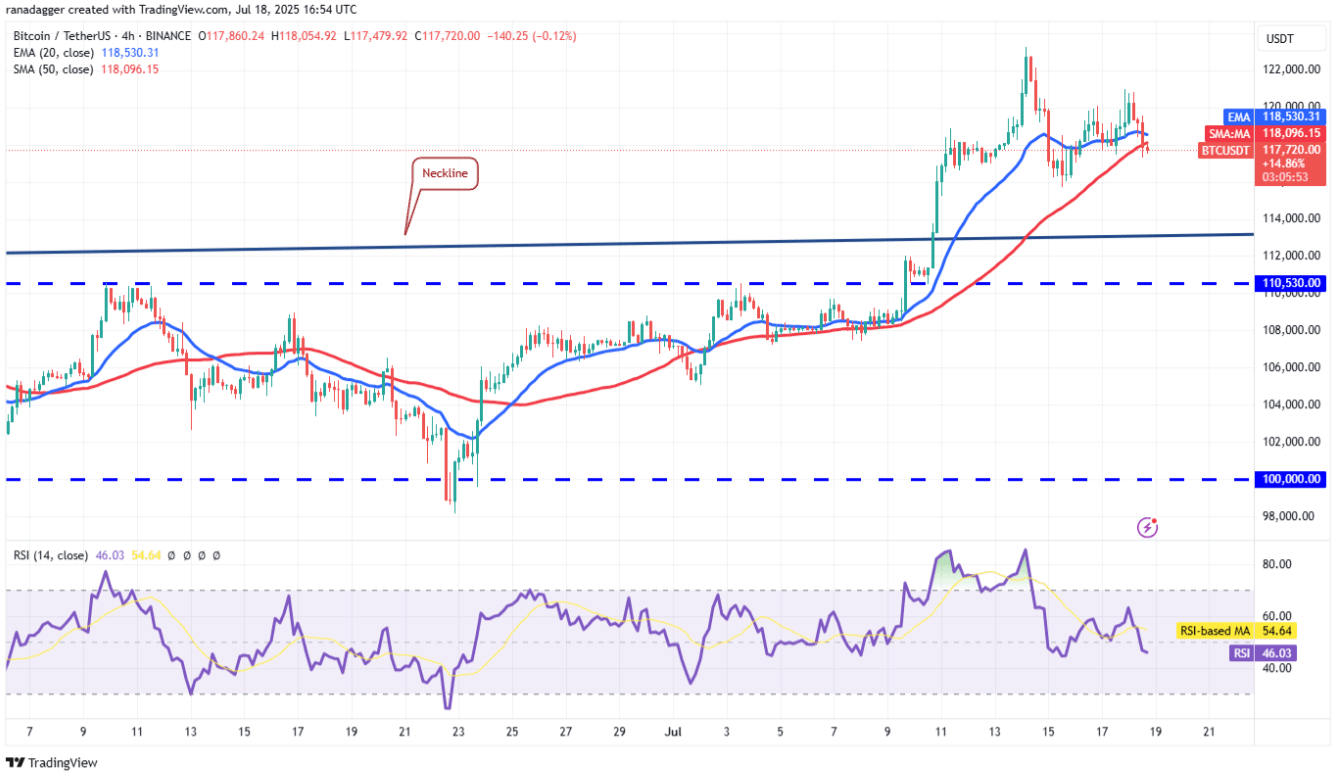
Currently, the price has slipped below the 50-period simple moving average (SMA), indicating that the bulls are losing strength. This pair could fall to the $115,000 mark – an important support level that needs to be protected. If this area is not held, the BTC/USDT pair is likely to retest the range from the neckline of the inverse head and shoulders pattern to the support level of $110,530.
If the price bounces from the support area, the bulls will once again attempt to push the price above the $123,218 mark. If successful, this pair could continue to rise to $130,000, and then to $135,729.
Technical analysis of BNB
BNB has regained its upward momentum after breaking and closing above the resistance level of $698 on Wednesday.
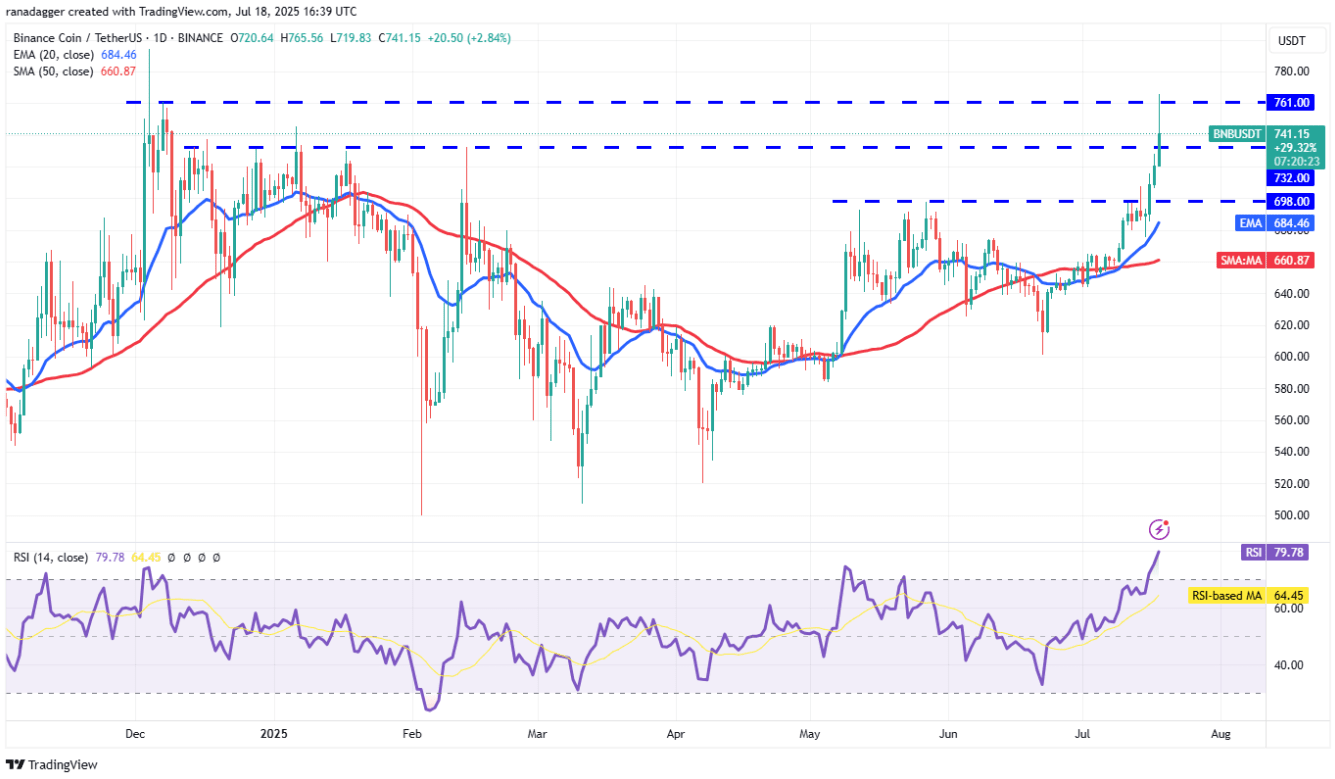
The BNB/USDT pair has broken through the $732 mark and reached $761 on Friday, where the bears are staging a strong defense. If the bulls do not allow the price to fall below $732, it reflects a positive market sentiment and opens up the opportunity for a breakout above $761. At that point, this pair could soar to the $794 area.
Conversely, if the price continues to decline and breaks through the $732 mark, it indicates the possibility of forming a trading range. This pair may trade within the range of $698 - $761 for a period.
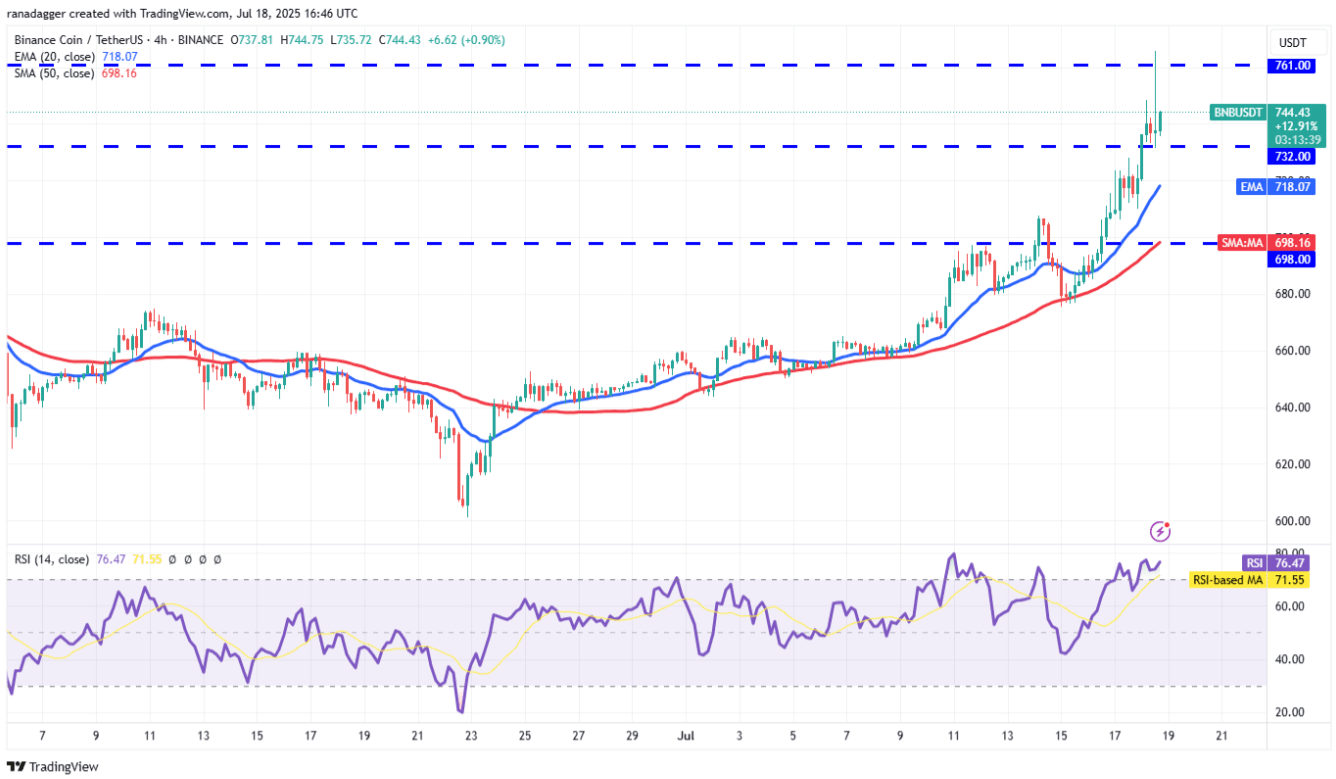
Both moving averages are trending upwards, and the RSI index is in the overbought zone on the 4-hour chart – a sign that the bulls are in control. Although the price has reversed from $765, a positive point is that the bulls did not allow the price to drop significantly below $732. Buyers are likely to try again to push the price above $794.
The first sign of weakness will appear if the price closes below the $732 mark. Selling pressure may increase if this pair breaks the 20-period EMA.
Technical analysis of XLM
Stellar (XLM) has surged strongly in recent days and has now reached the resistance level of $0.51.
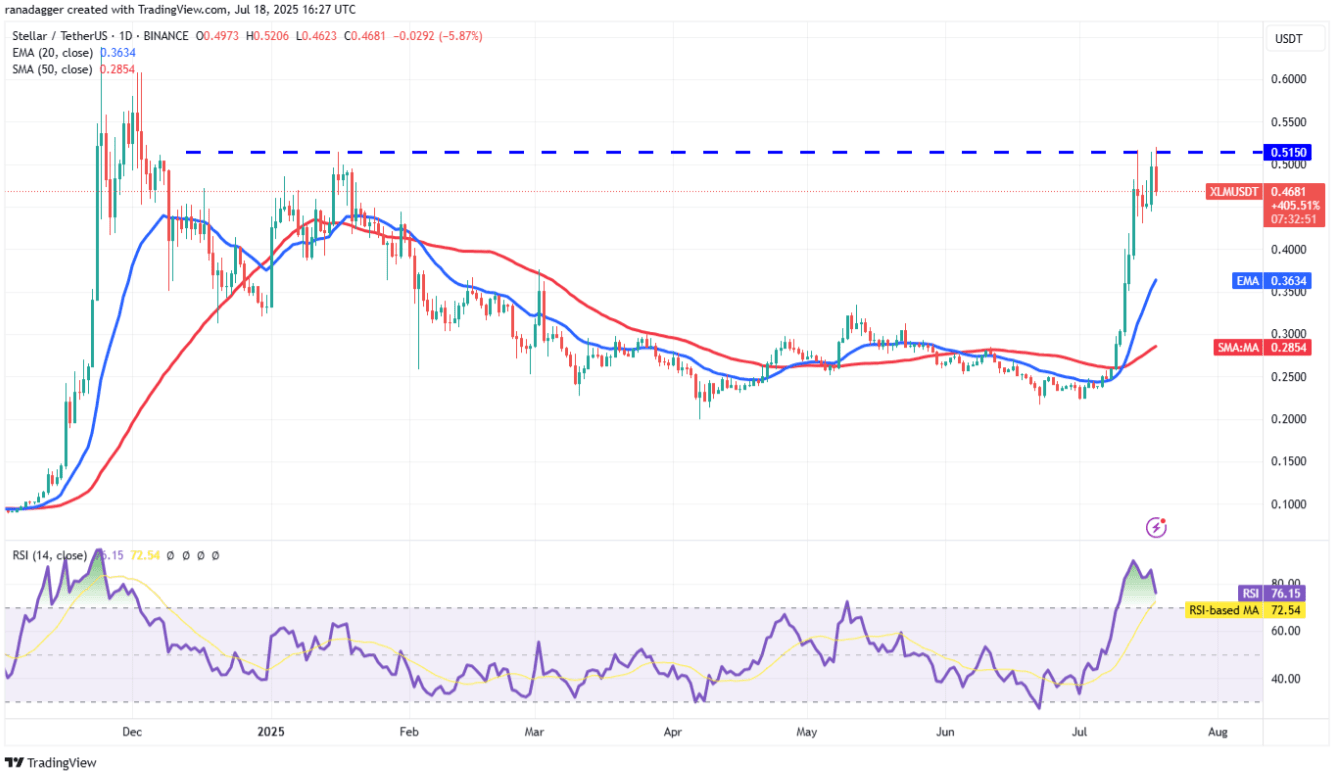
The uptrend has pushed the RSI index into overbought territory, indicating that a period of consolidation or slight correction may occur in the short term. If the bulls do not allow the price to fall below $0.43, the XLM/USDT pair could break above $0.51. At that point, the price could begin the next surge towards $0.64 and further to the target of $0.80.
However, this positive scenario will be negated if the price reverses and closes below $0.43. At that point, the pair could retreat to the 20-day EMA at $0.36.
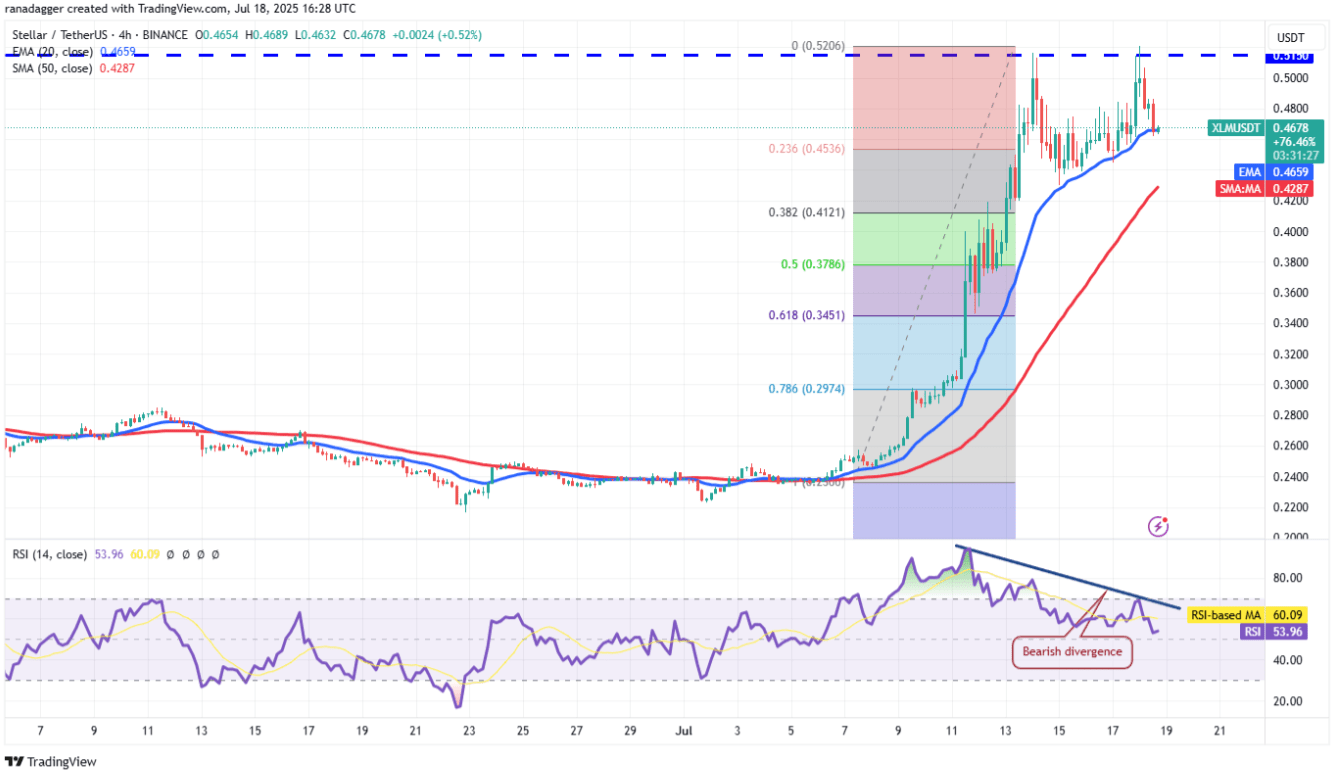
On the 4-hour chart, the RSI indicator is signaling early bearish divergence – a sign that the uptrend is weakening. If the 20-period EMA is broken, the price could fall to the 50-period SMA. This is an important support level to watch, as breaking it could lead the pair to drop deep to the 50% Fibonacci retracement area at $0.37.
Conversely, if the price strongly bounces from the 20-period EMA, it indicates that investors are still buying as the price adjusts. This increases the probability of breaking the resistance level at $0.51 and continuing the uptrend to $0.59.
Technical analysis of LTC
Litecoin (LTC) has surged above the resistance level of $107 on Friday, but the bulls could not maintain prices higher, as indicated by the long wick on the daily candle.
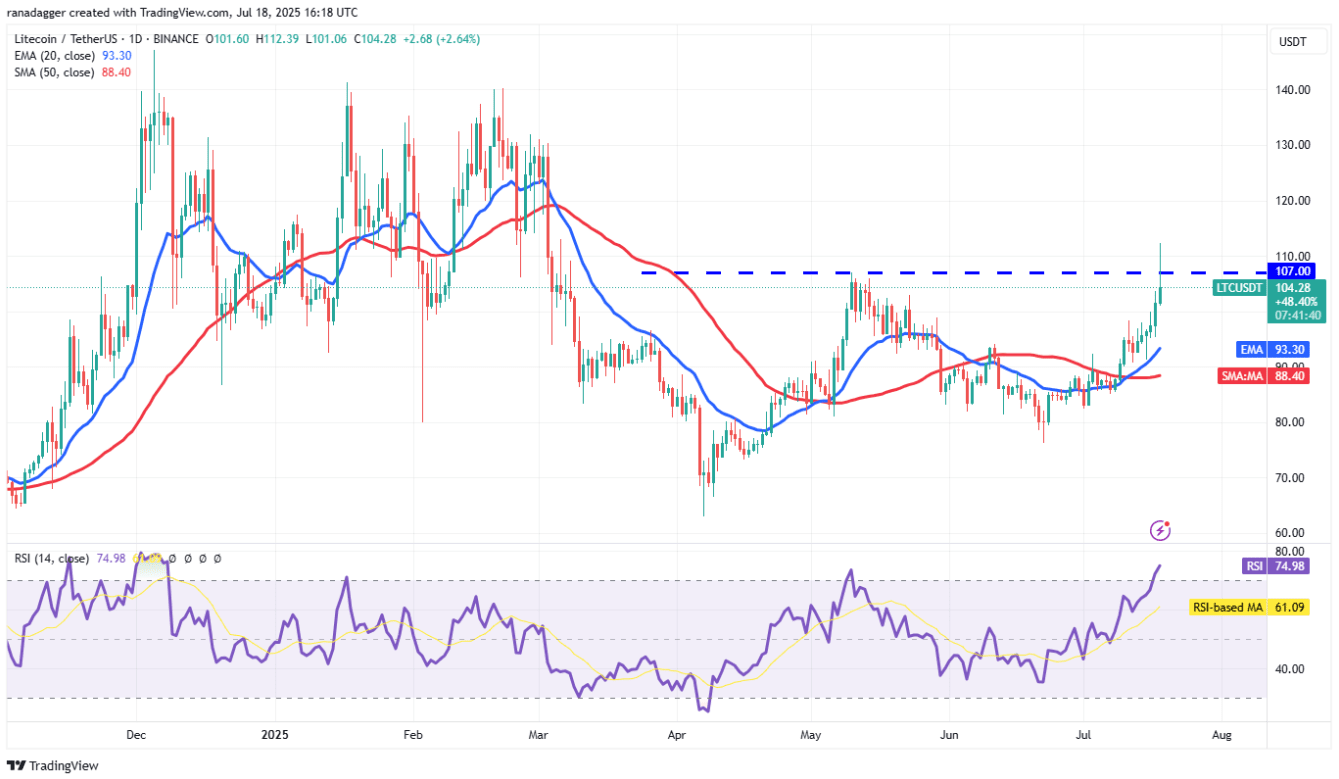
However, the bulls seem unlikely to give up easily. They will continue to strive to push the price above and maintain above the $107 mark. If successful, the LTC/USDT pair could soar to $130, and then to $140.
However, the bears are plotting the opposite. They will try to keep the price below the $107 mark. If they succeed, this pair could drop to the 20-day exponential moving average (EMA) at $93. A deeper correction could slow down the current recovery.
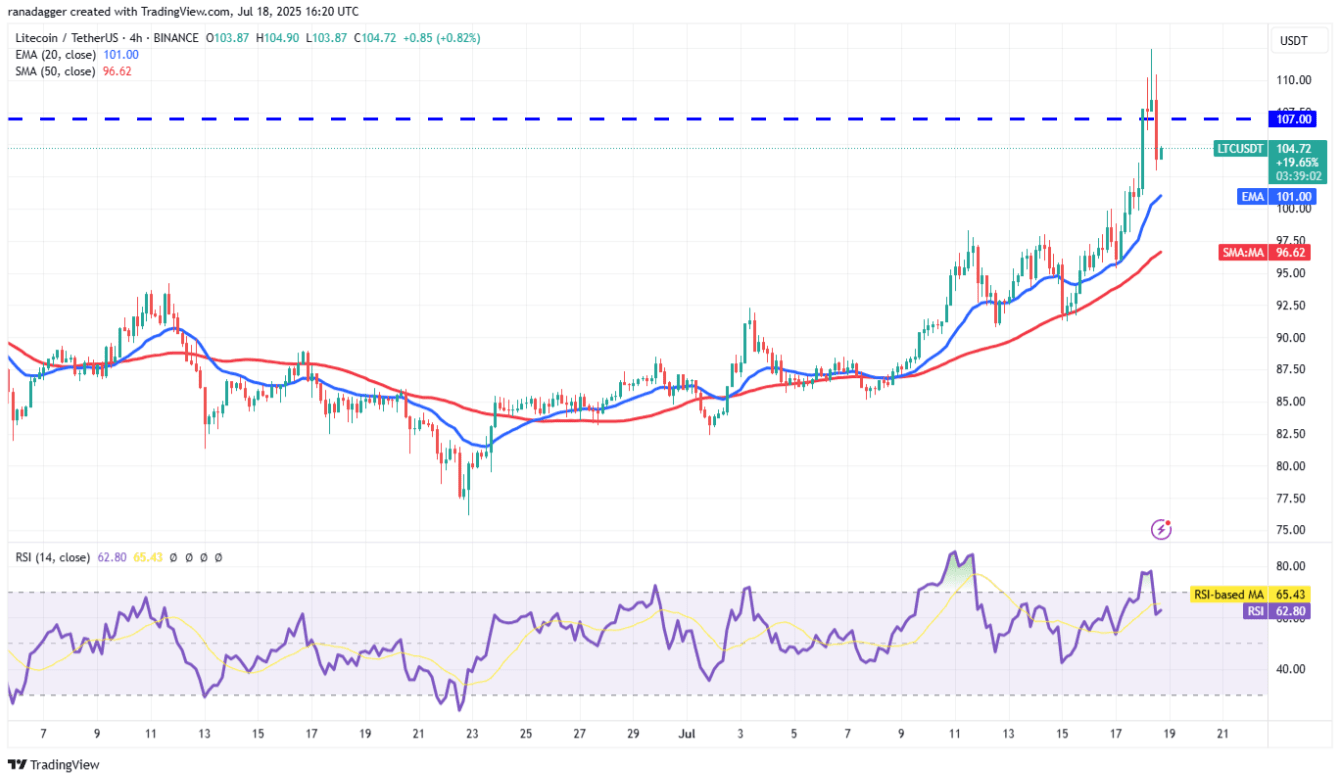
The bears have pulled the price below the $107 mark, indicating strong selling pressure at high price levels. The LTC/USDT pair may continue to decline towards the 20-period EMA – this will be an important support level to watch. If the price bounces strongly from the 20 EMA, the bulls will once again try to push the price above the $112 threshold. If successful, the pair could continue to rise to $120 and then to $130.
On the contrary, if the price breaks below the 20-period EMA, it indicates that short-term investors are taking profits. This scenario could pull the price down to the 50-period simple moving average (SMA).
Technical analysis of ETC
Ethereum Classic (ETC) has surged above the resistance level of $21.70 on Friday, indicating that the bulls are returning to the market.
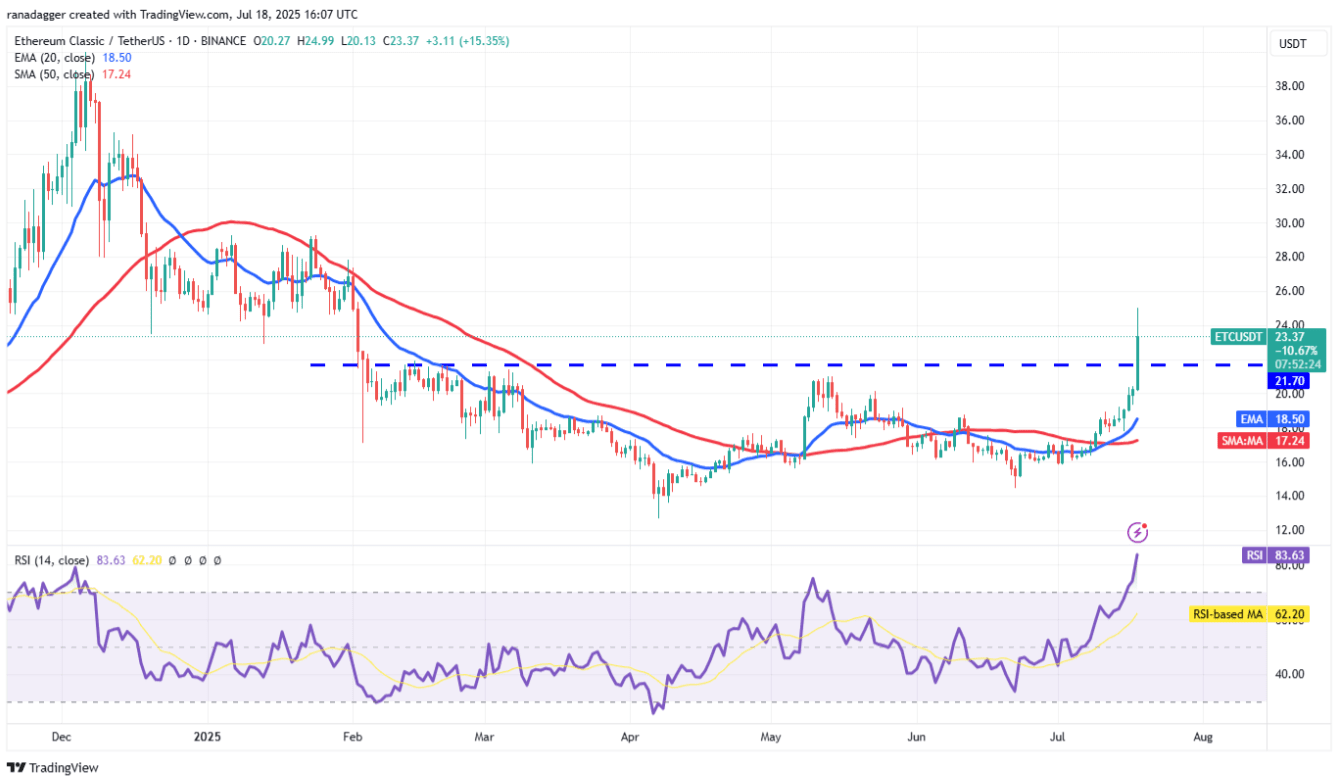
The strong uptrend has pushed the RSI index into overbought territory, indicating that a period of consolidation or slight correction may occur in the short term. The ETC/USDT pair may retest the breakout level at $21.70. If the price bounces strongly from this level, it indicates that the bulls have turned the resistance level into support, thus increasing the likelihood of the price continuing to rise to $27.
Conversely, if the price drops below $21.70, it indicates that the market has rejected the previous breakout. At that point, the pair could plummet to the 20-day EMA at $18.50.
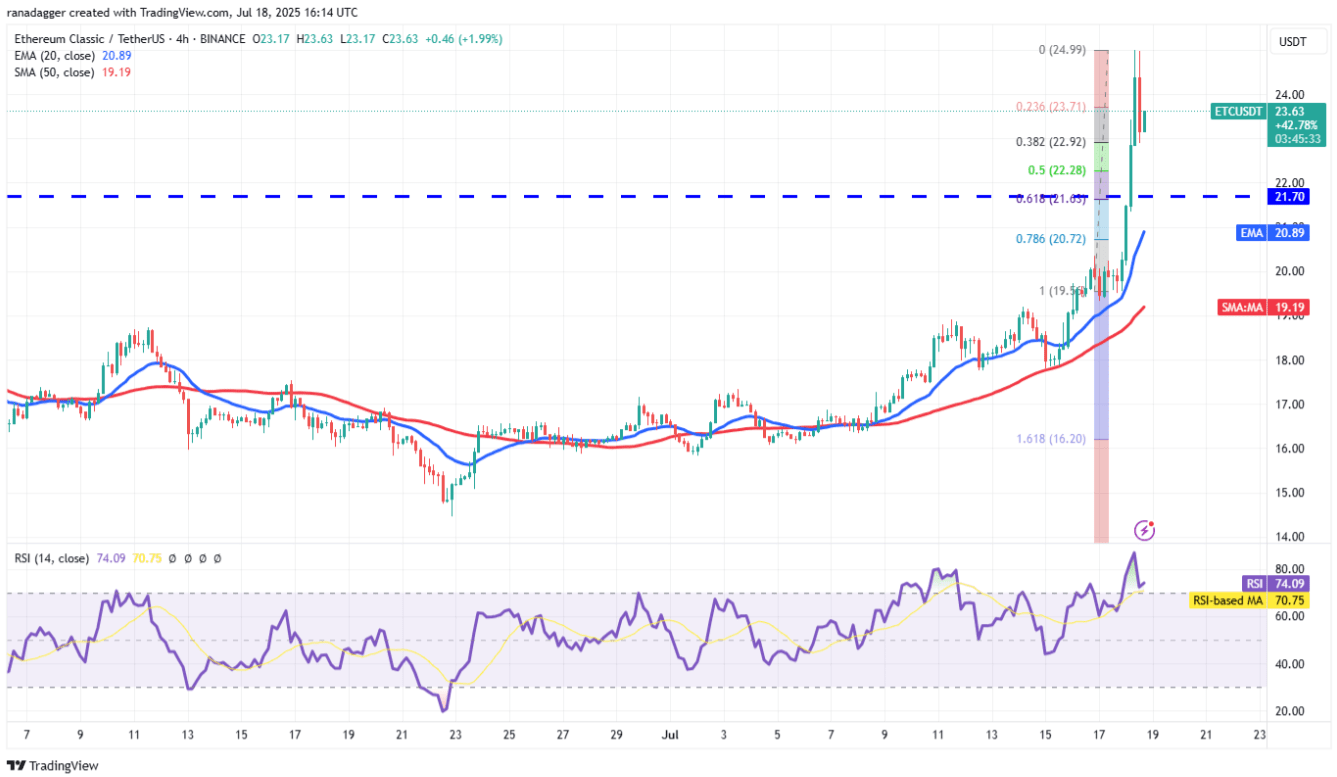
The current uptrend is encountering profit-taking pressure around $24.99, causing the price to adjust to the 38.2% Fibonacci retracement level at $22.92. If the price bounces back from this area, the bulls will try to resume the uptrend. If successful, the price could rise to $27.
However, if the price breaks and closes below $22.92, the pair could fall to the important support level at $21.70. The bulls need to strongly defend this level to maintain the uptrend. If they fail, ETC could plummet to $19.56 – completing a 100% retracement of the most recent rally.