

🚀📈 Analysis of the CVX/USDT chart! 📉🧐
Friends, let's break down what's happening with the CVX/USDT pair
Current situation:
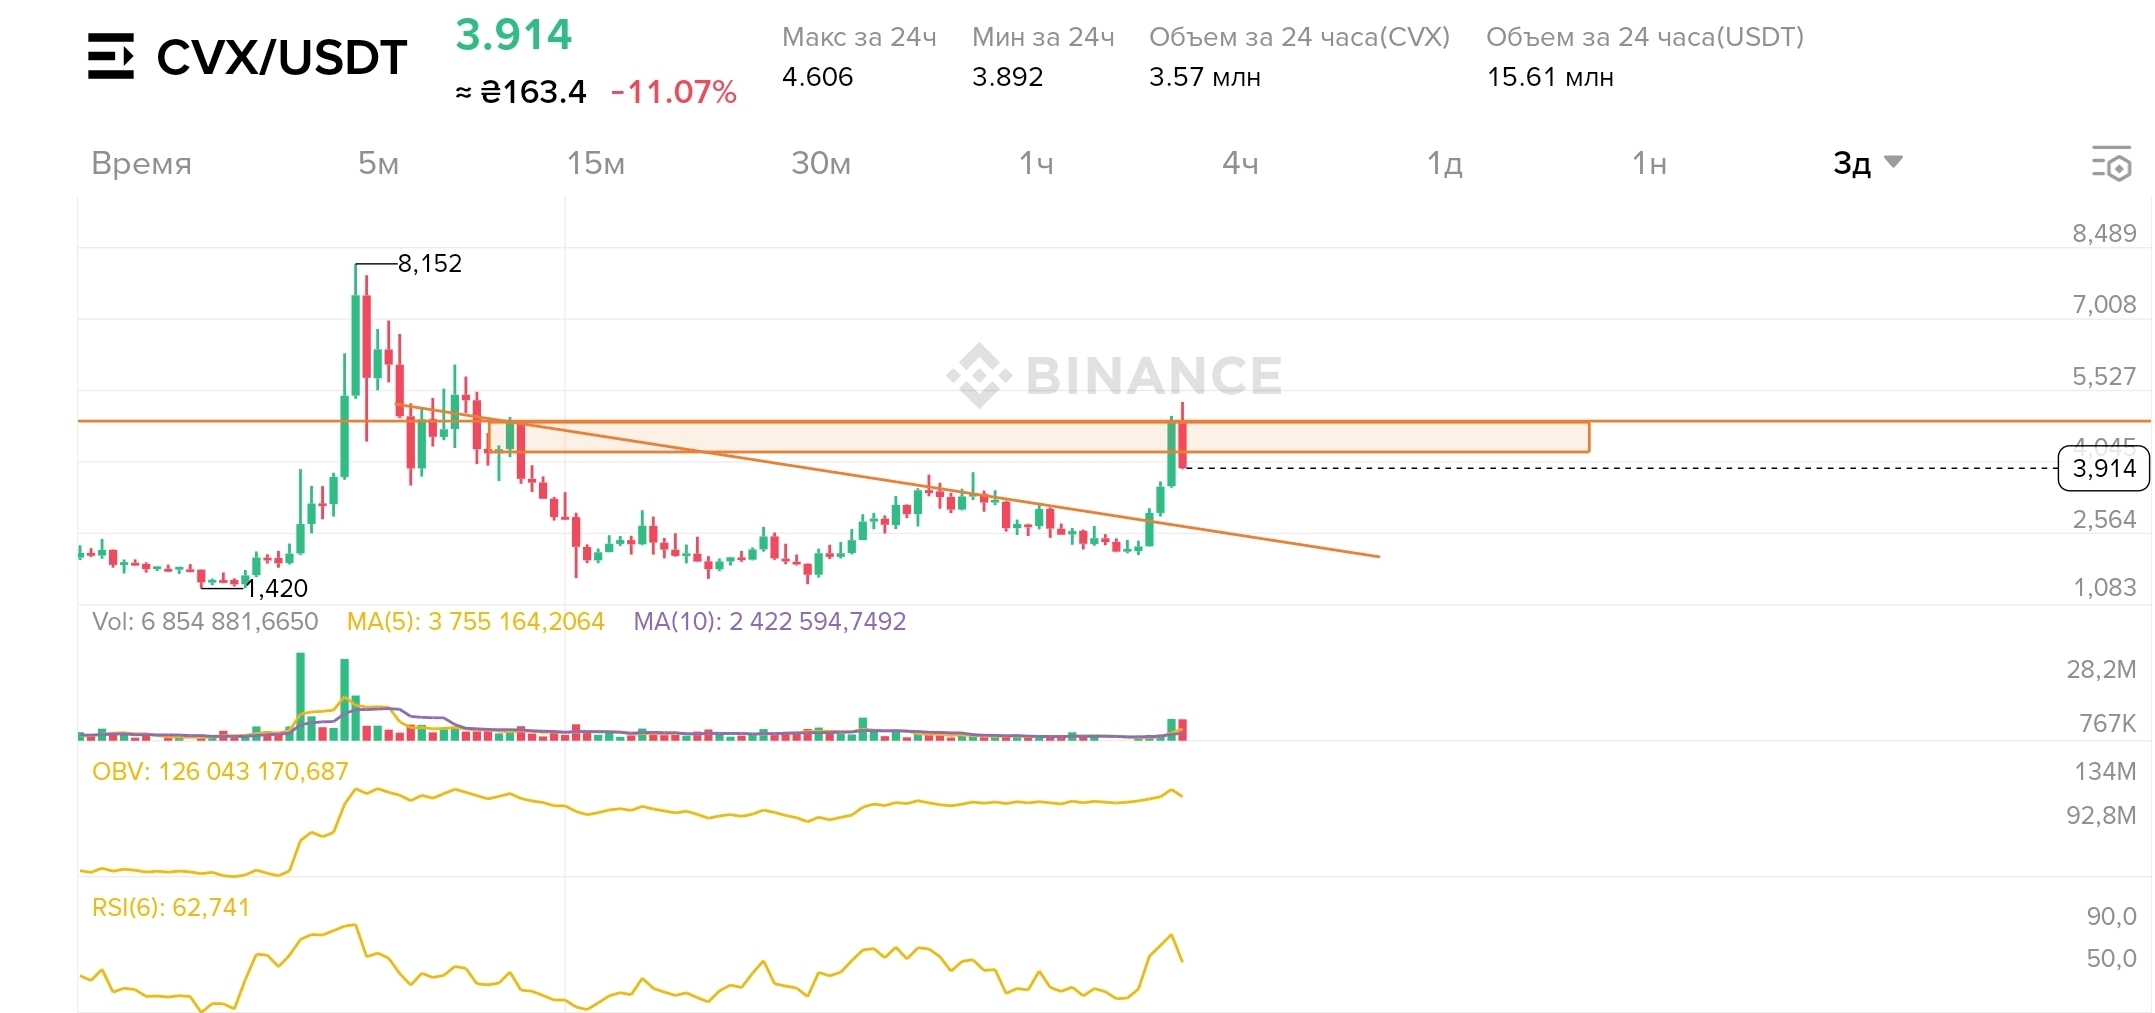
The price is currently at $3.914, which is a decrease of 11.07% or $0.463 in the last 24 hours. 😬
What do we see on the chart?
* Historical peaks: Not so long ago, CVX was trading much higher, reaching a peak of about $8.152! 🏔️
* Decline and consolidation: After this peak, we observed a significant decline, and the price moved in a downward trend for a long time, trying to find support.
* Breakthrough resistance? The chart shows a clear downward trend (orange line). However, recently, there was a noticeable breakout upwards that pushed the price outside of this trend! 🎉
* Resistance/potential support zone: In the area of $4.00 - $4.40 (highlighted with an orange rectangle), the price encountered a strong resistance zone that previously acted as support. The price has now bounced off this zone. 🚧
* Volumes: Pay attention to trading volumes (Vol): there were significant volumes at the peak and during the recent breakout, confirming interest in the asset. 📊
* Indicators:
* OBV (On-Balance Volume): The OBV indicator shows that volumes increased during the recent upward movement, which may indicate bullish sentiment. ⬆️
* RSI (Relative Strength Index) (6): RSI at 62.741, which is in the bullish zone, but not overbought. There is still potential for growth, but caution is advised. ⚠️
What does this mean?
The recent breakout of the downward trend is a positive sign! This may indicate a potential change in trend from downward to upward. However, the $4.00-$4.40 zone is key. If the price can confidently consolidate above this zone, it will be a strong bullish signal. If not, there may be a retest of lower levels.
Insights for yourself:
* We are monitoring the consolidation above $4.00 - $4.40. This is a critical level! 👀
* Volumes support the movement, but always remember the risks! 🚨
* RSI dynamics suggest further growth, but without excessive enthusiasm.
Remember, this is not financial advice, just an analysis of the chart. Always conduct your own research! DYOR! 🤓
Successful trading! 💰🚀
