✅ First: A quick look at the overall condition
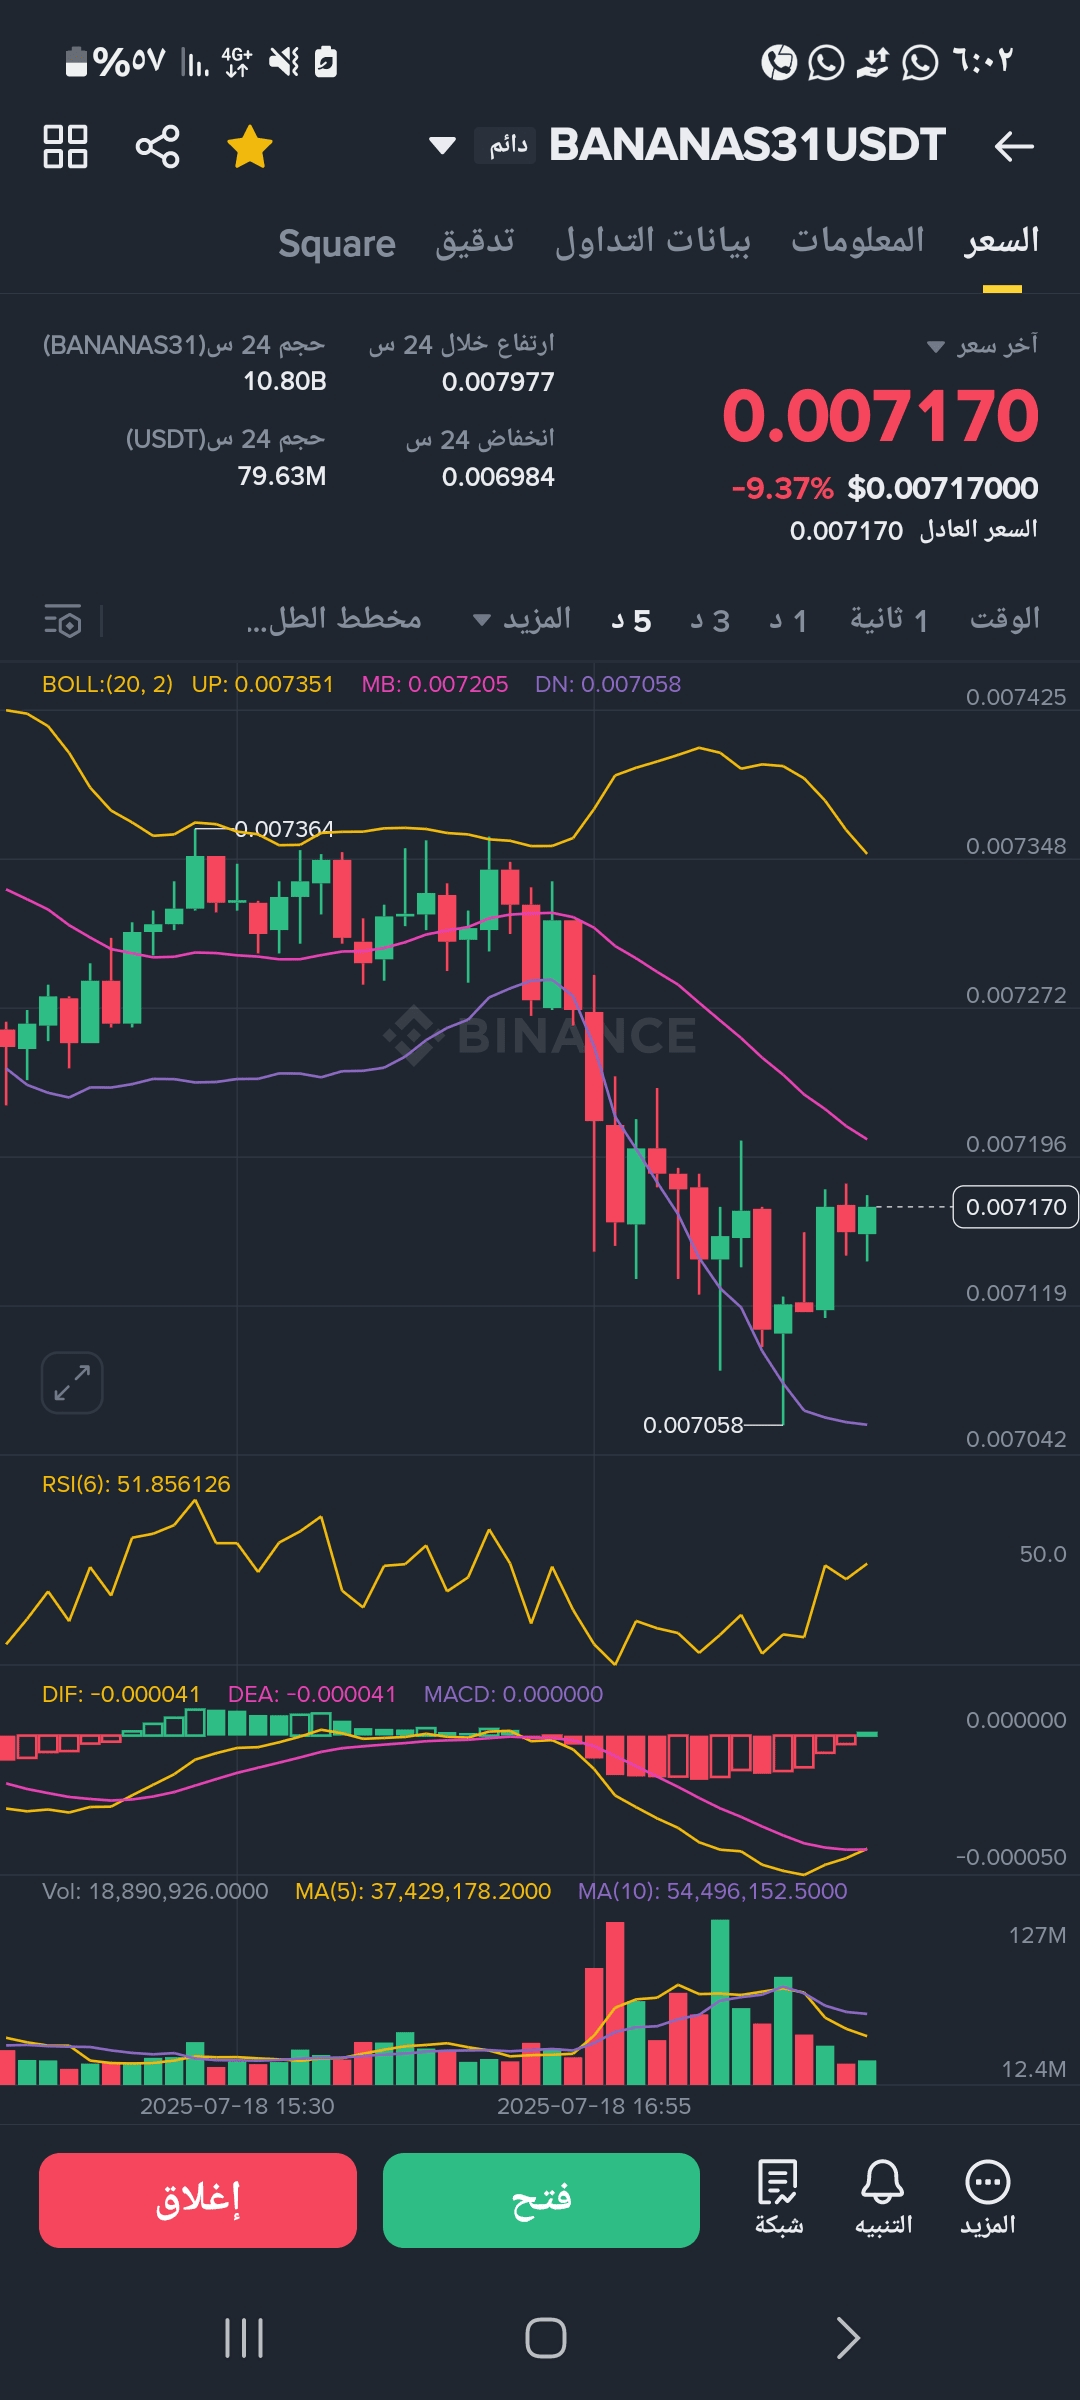
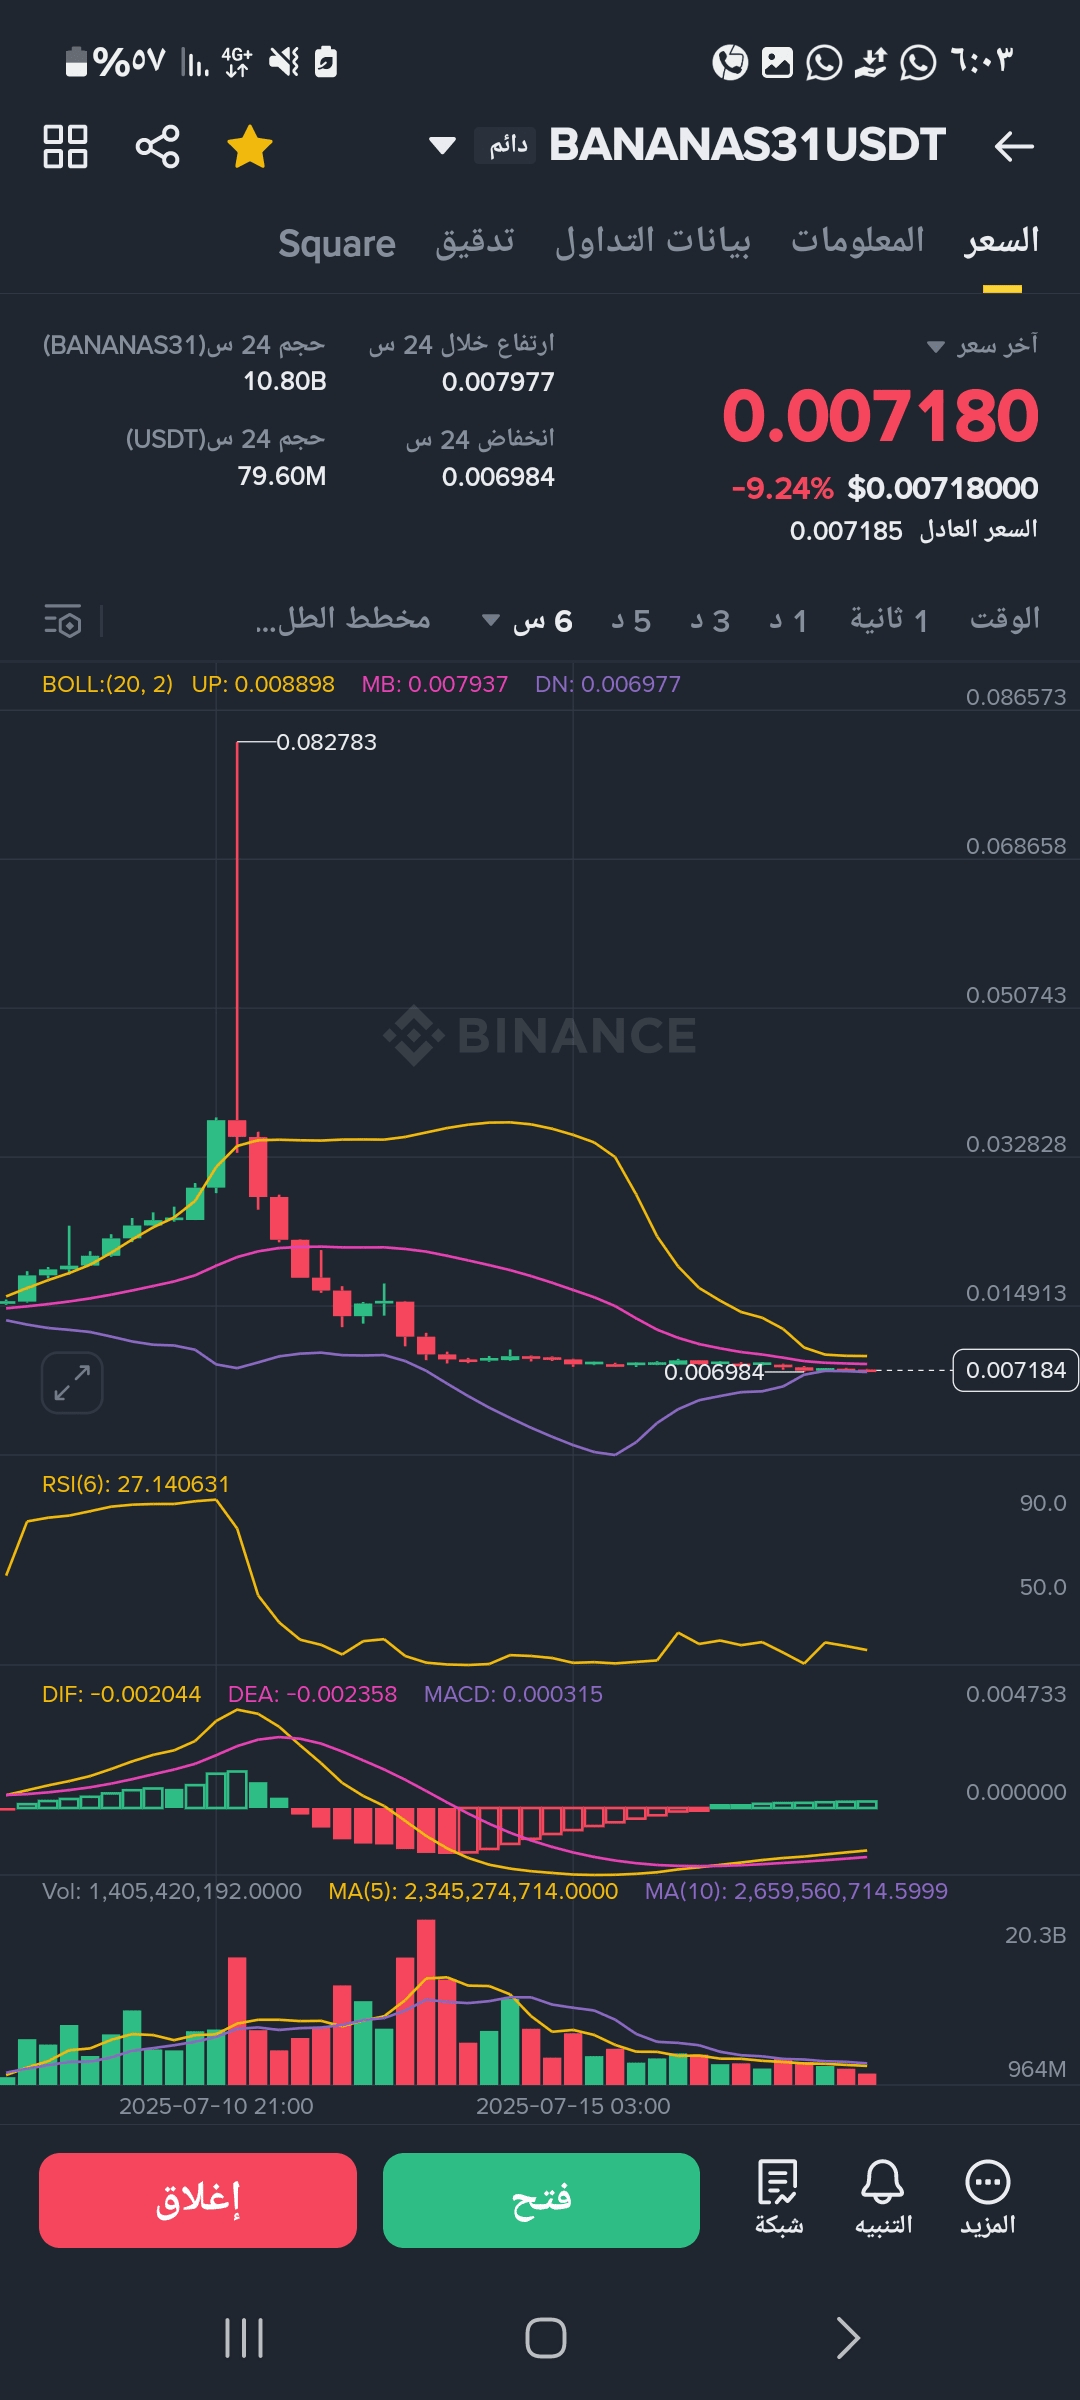
Current price: 0.00717 – 0.00718
Lowest price in 24 hours: 0.006984
Highest price in 24 hours: 0.007977
Daily drop: approximately -9.2%
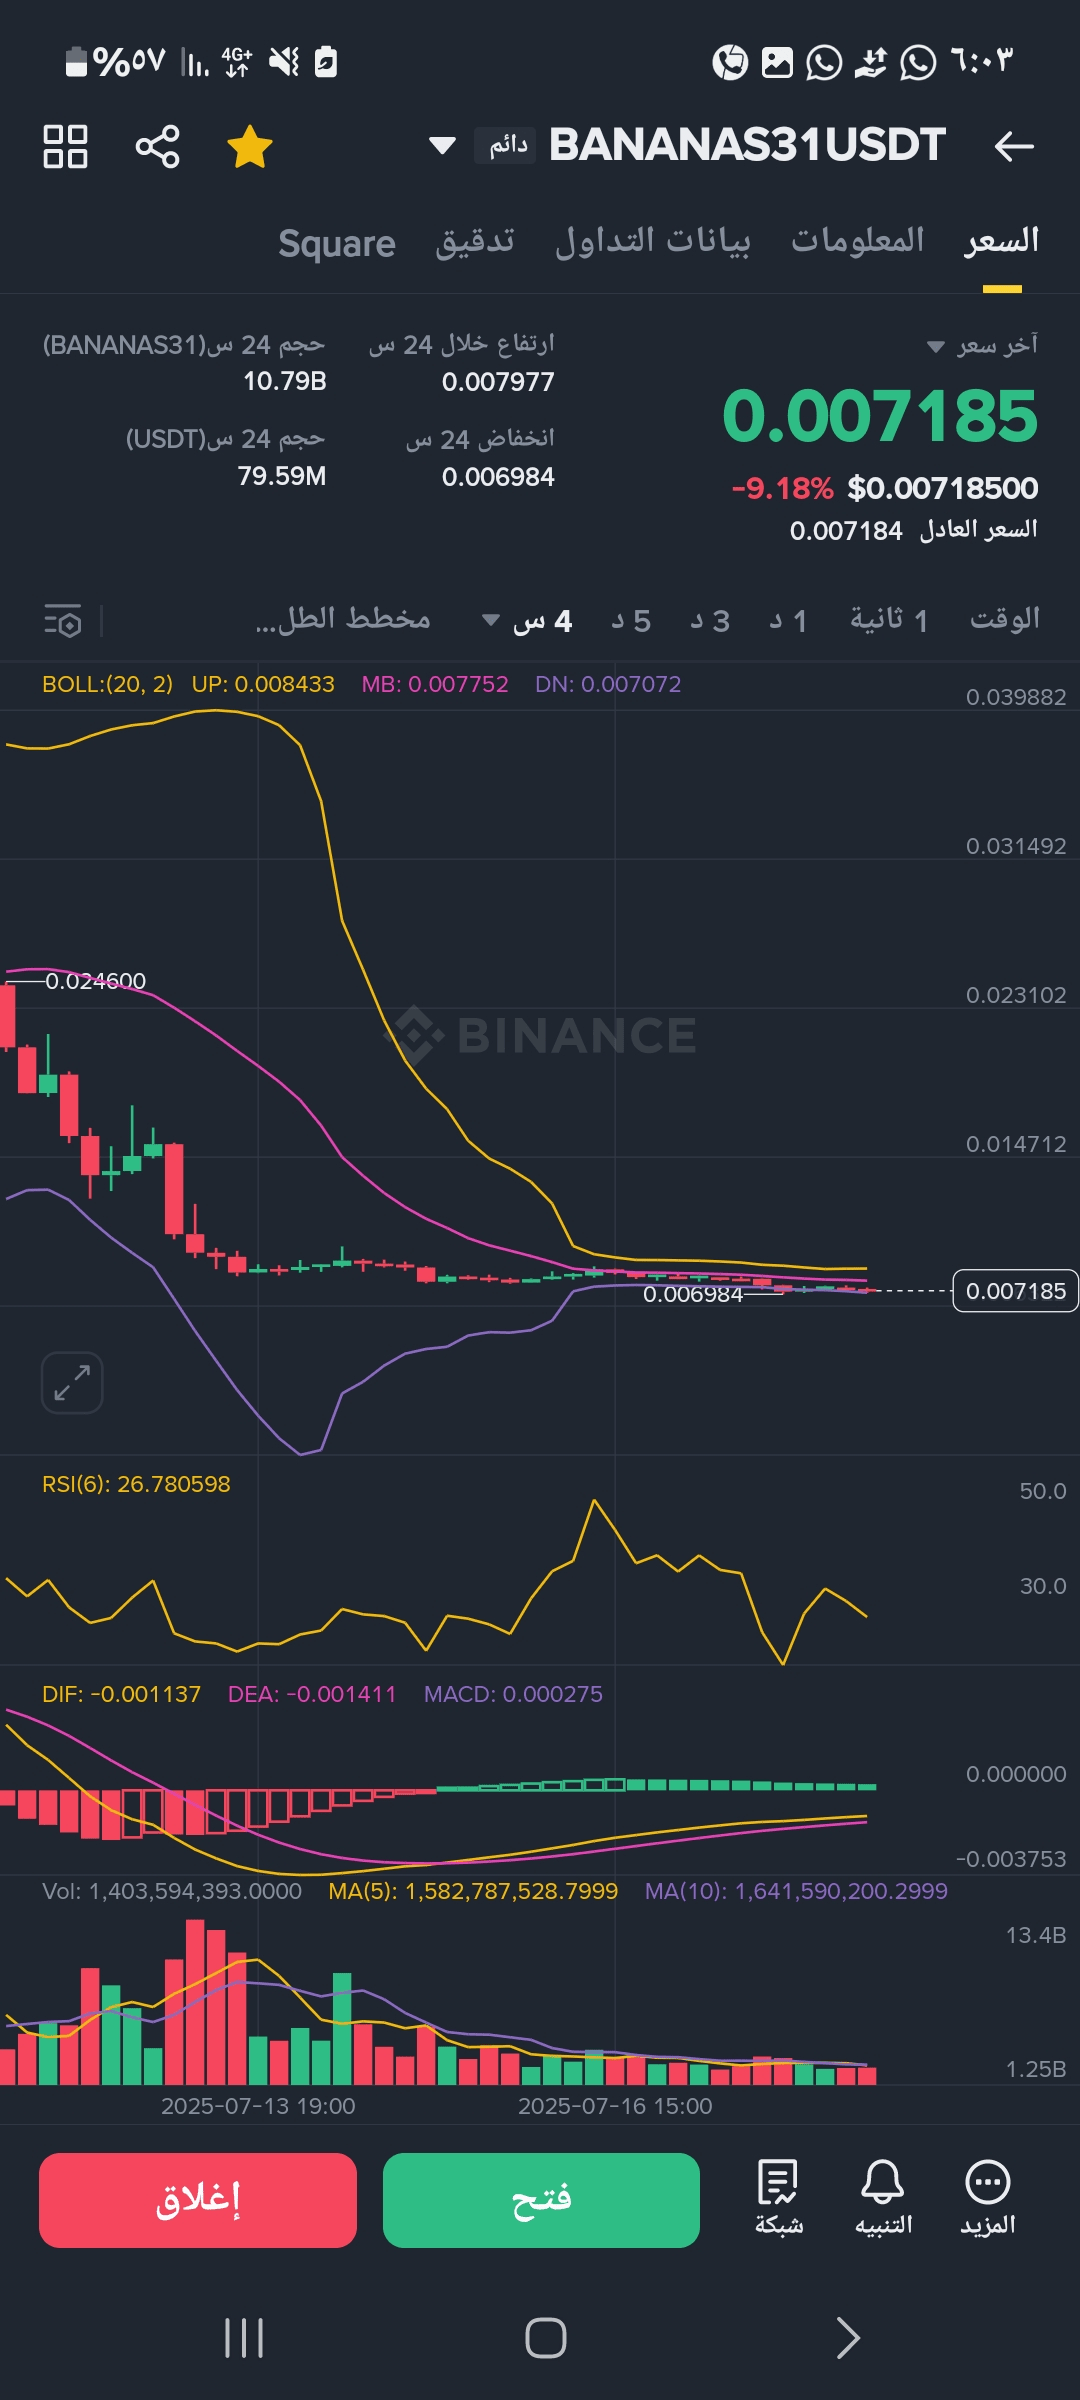
The market is in a clear selling pressure but with the beginning of a technical rebound from the bottom.
📉 Candles and support and resistance areas
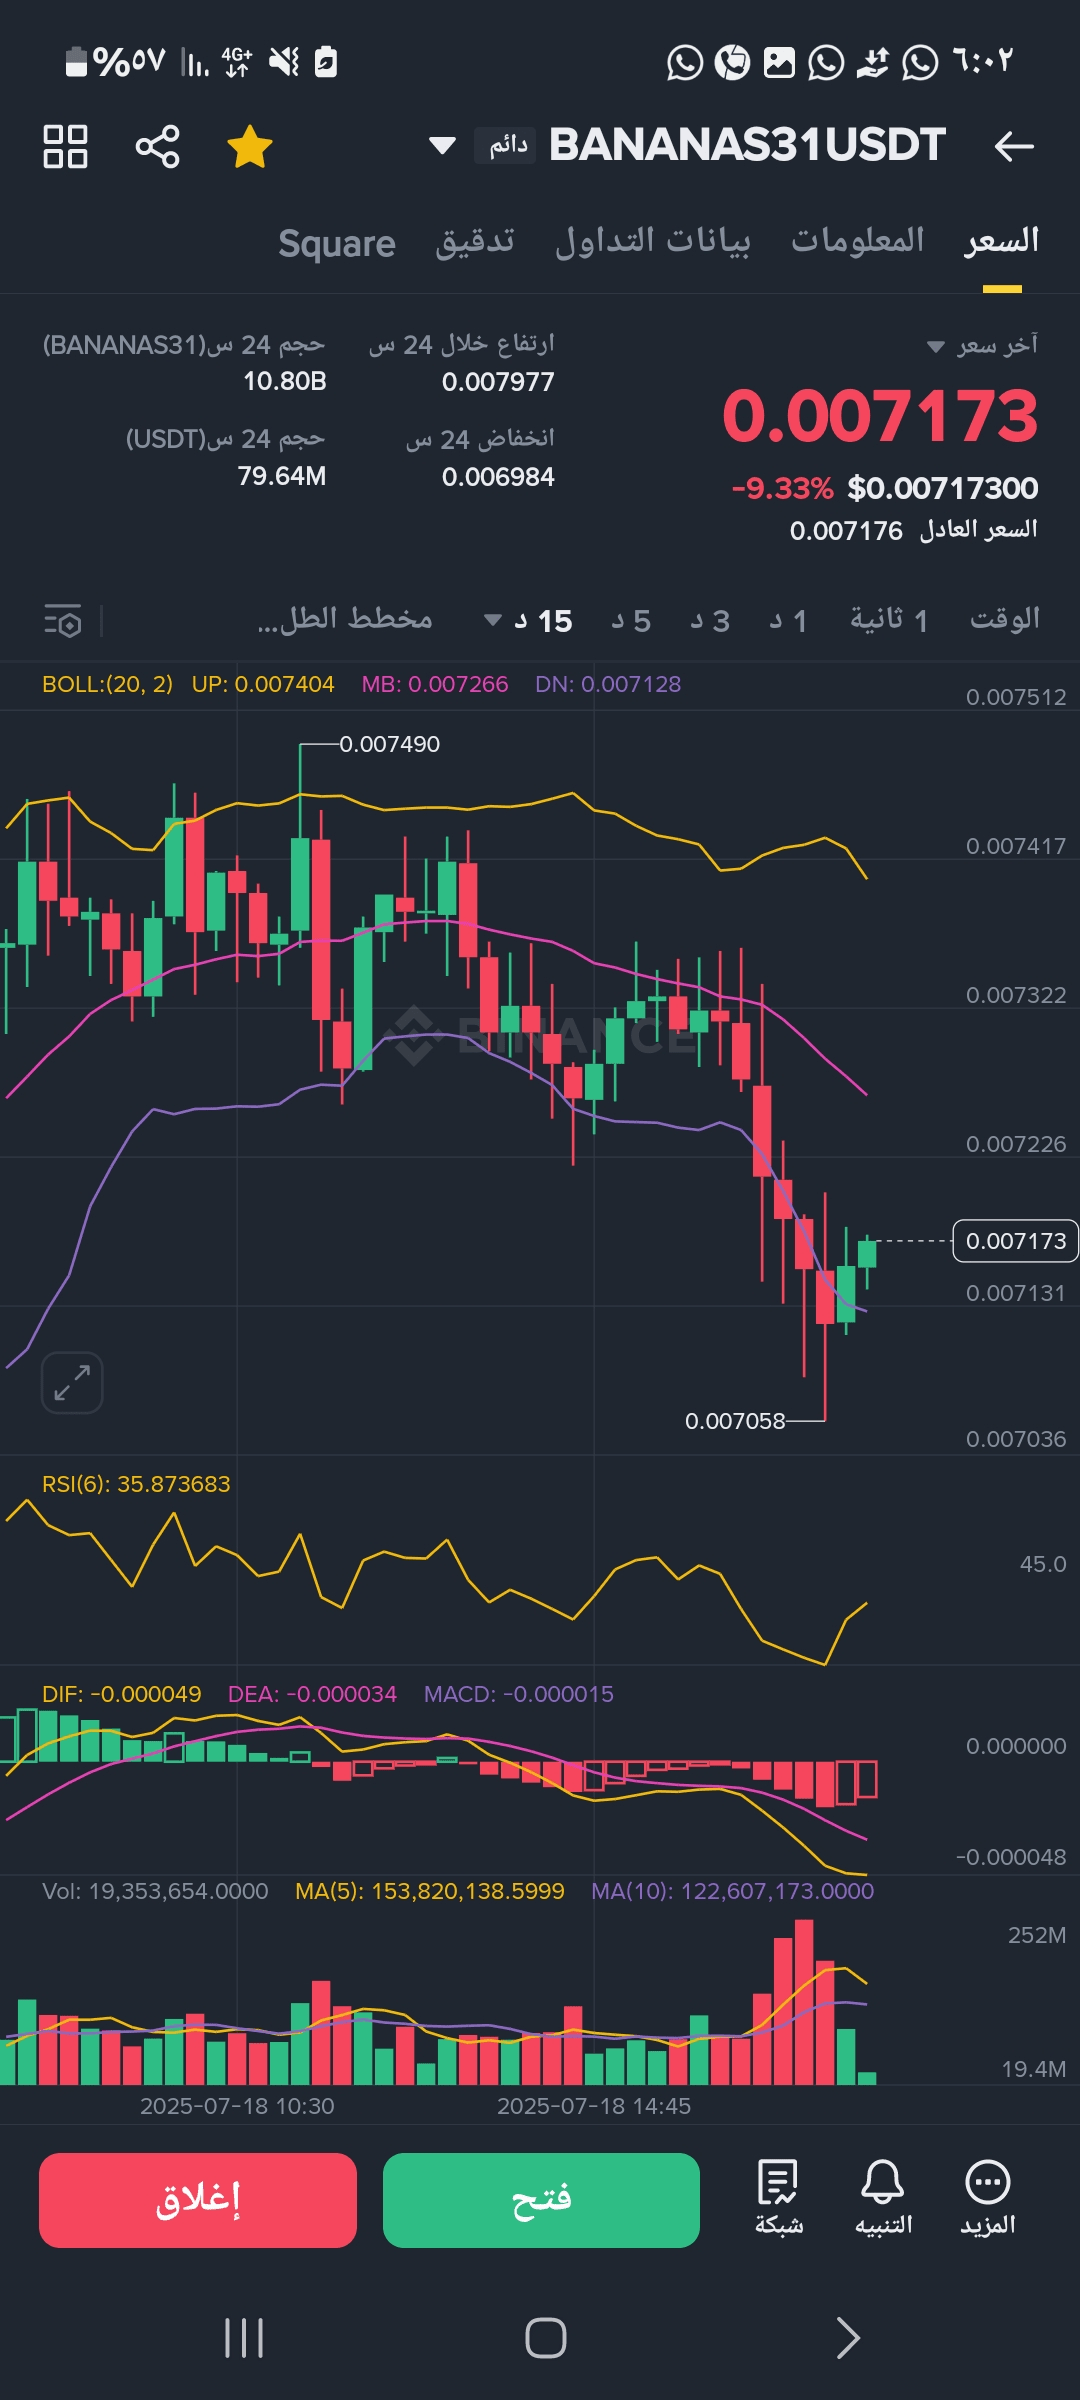
There is a clear rebound from the bottom 0.006984 / 0.007058, indicating strong support in this area.
The recent green candles (on the 1-minute and 15-minute frames) give slight correction signals upwards but the averages have not been broken yet.
📊 Technical indicators:
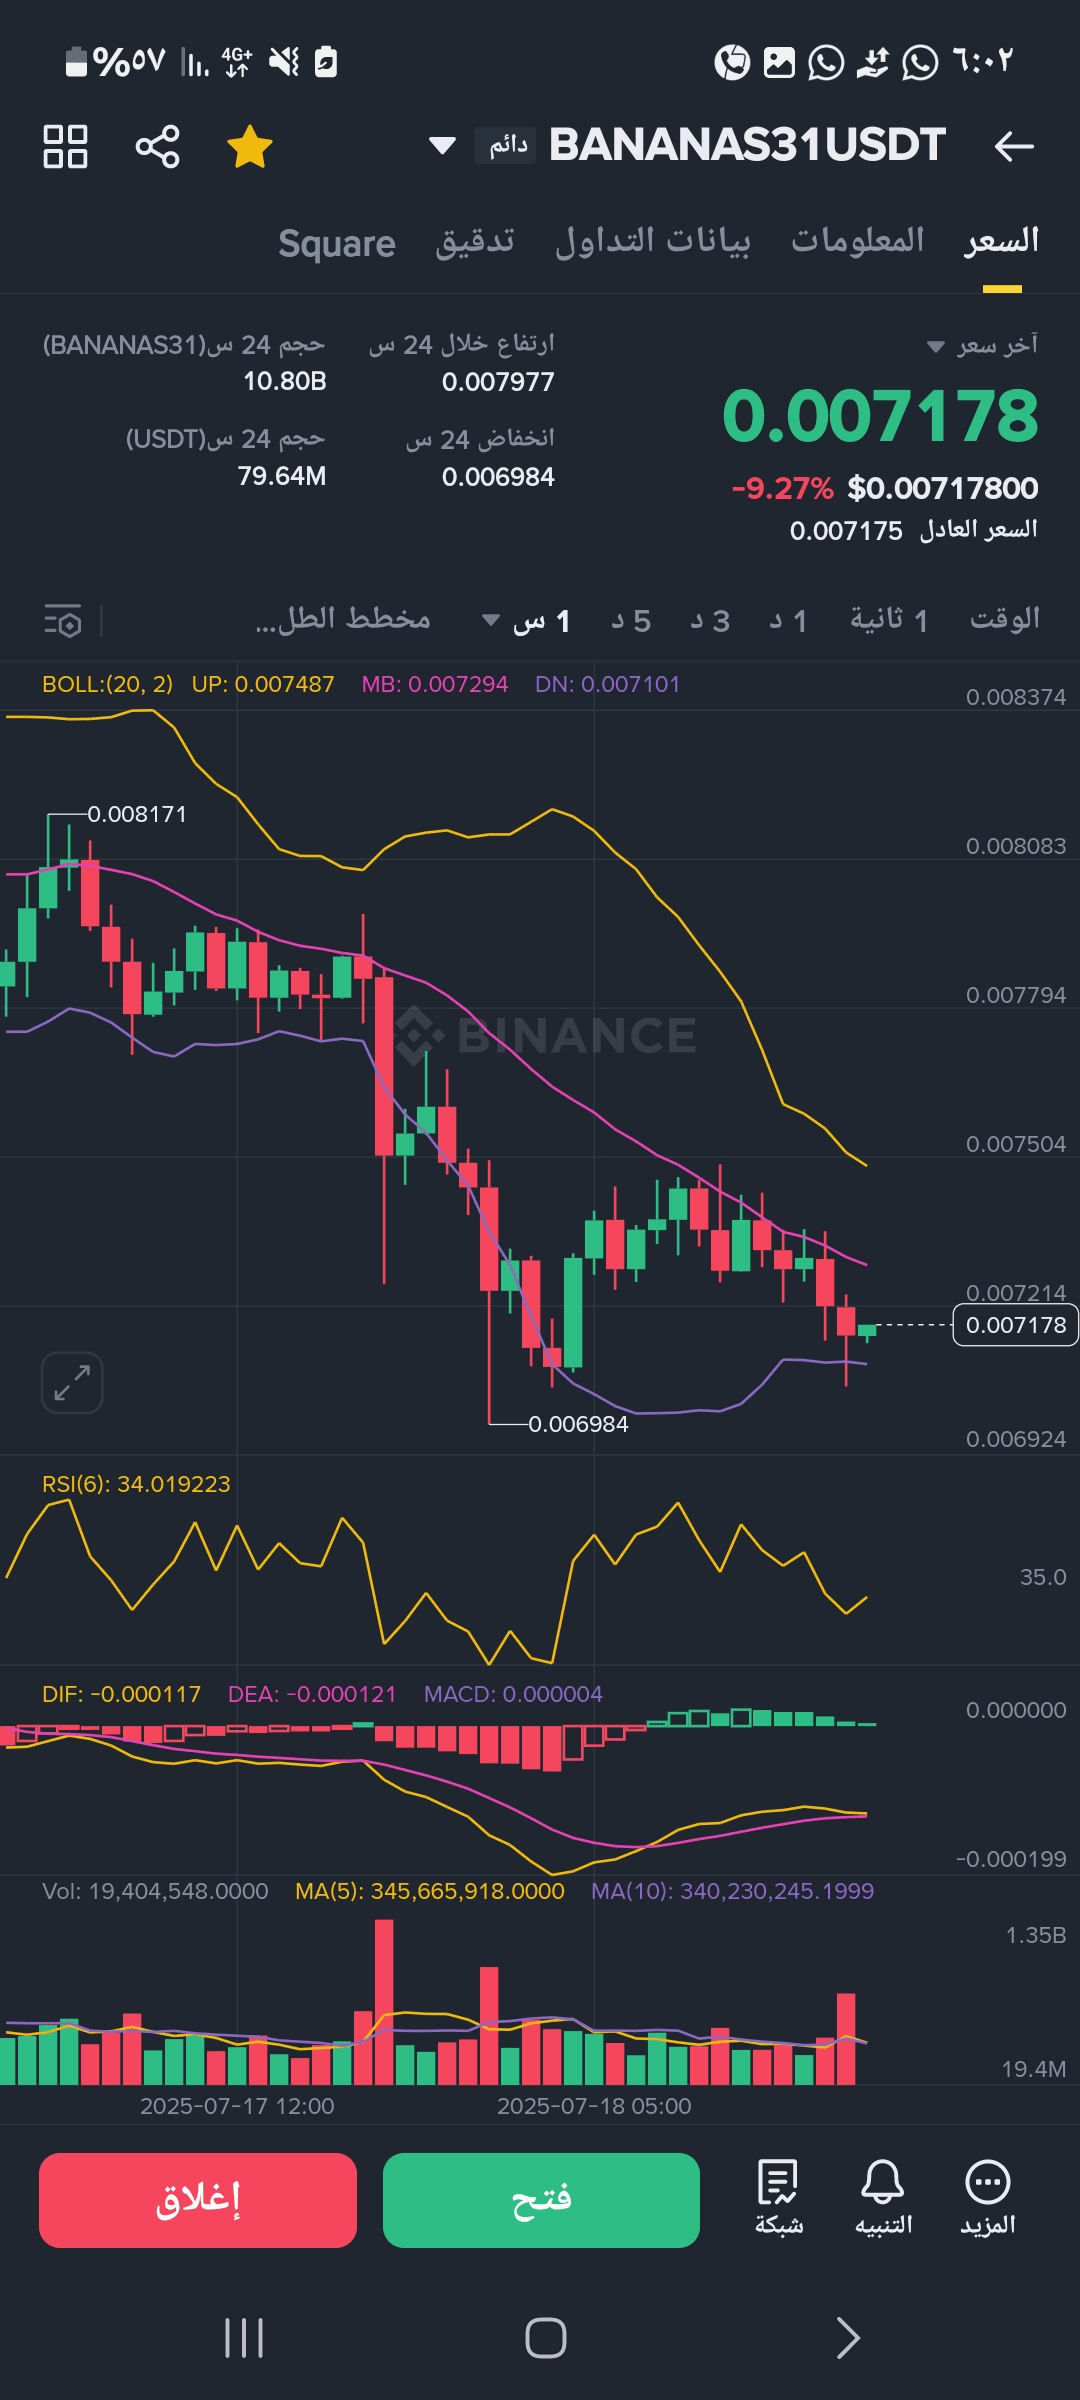
✅ RSI (Relative Strength Index):
In most frames between 26 – 35 → oversold ➜ this supports the occurrence of a temporary rebound upwards.
✅ Bollinger Bands:
The price in all frames is moving near or outside the lower limit → also a possible rebound signal.
Bollinger convergence means a potential price explosion coming (up or down).
✅ MACD:
Convergence is shown in all frames with the beginning of a decline ➜ Initial positive signal but no strong bullish crossover has occurred yet.
✅ Volume (trading size):
We noticed an increase in buying volume at the bottom → this enhances the likelihood of a short-term rise.
🧭 Expected direction in the coming hours:
🔺 Positive scenario (closest currently):
Technical rebound towards areas:
🔹 0.00725 (closest resistance)
🔹 Then 0.00735 - 0.00745 (medium resistance)
🔹 And if 0.00750 is strongly broken, we start targeting 0.00785 – 0.0080
🔻 Negative scenario (if the rise fails):
Breaking the level of 0.006984 will lead to a sharp drop towards:
🔻 0.00680 – 0.00660
🔻 Then 0.00620 (danger zone)
🎯 Recommendation for day traders:
If you are in the trade from the bottom, you can hold with a strict stop loss below 0.00695.
If we close above 0.00735 positively, it gives a strong boost for the rise.
Monitor the volume and closing above the middle Bollinger (the purple line) carefully.#BinanceSquareFamily