

Bitcoin traded between $119,057 and $119,368 over the last hour, reflecting minimal intraday movement. With a market capitalization of $2.36 trillion and 24-hour trading volume at $57.83 billion, the cryptocurrency maintained a narrow intraday price range of $117,715 to $120,689.

Bitcoin
Bitcoin remains in a medium-term uptrend, having rallied from a swing low of $98,240 to a local high of $123,236, though recent price action suggests a loss of upward momentum. Oscillator readings from the relative strength index (RSI) at 69 and Stochastic at 73 both point to neutral conditions, signaling indecision across shorter timeframes. The daily chart shows stalling candles following the high at $123,236, with lower highs forming in the past few sessions—suggesting a weakening of bullish momentum and possible consolidation.
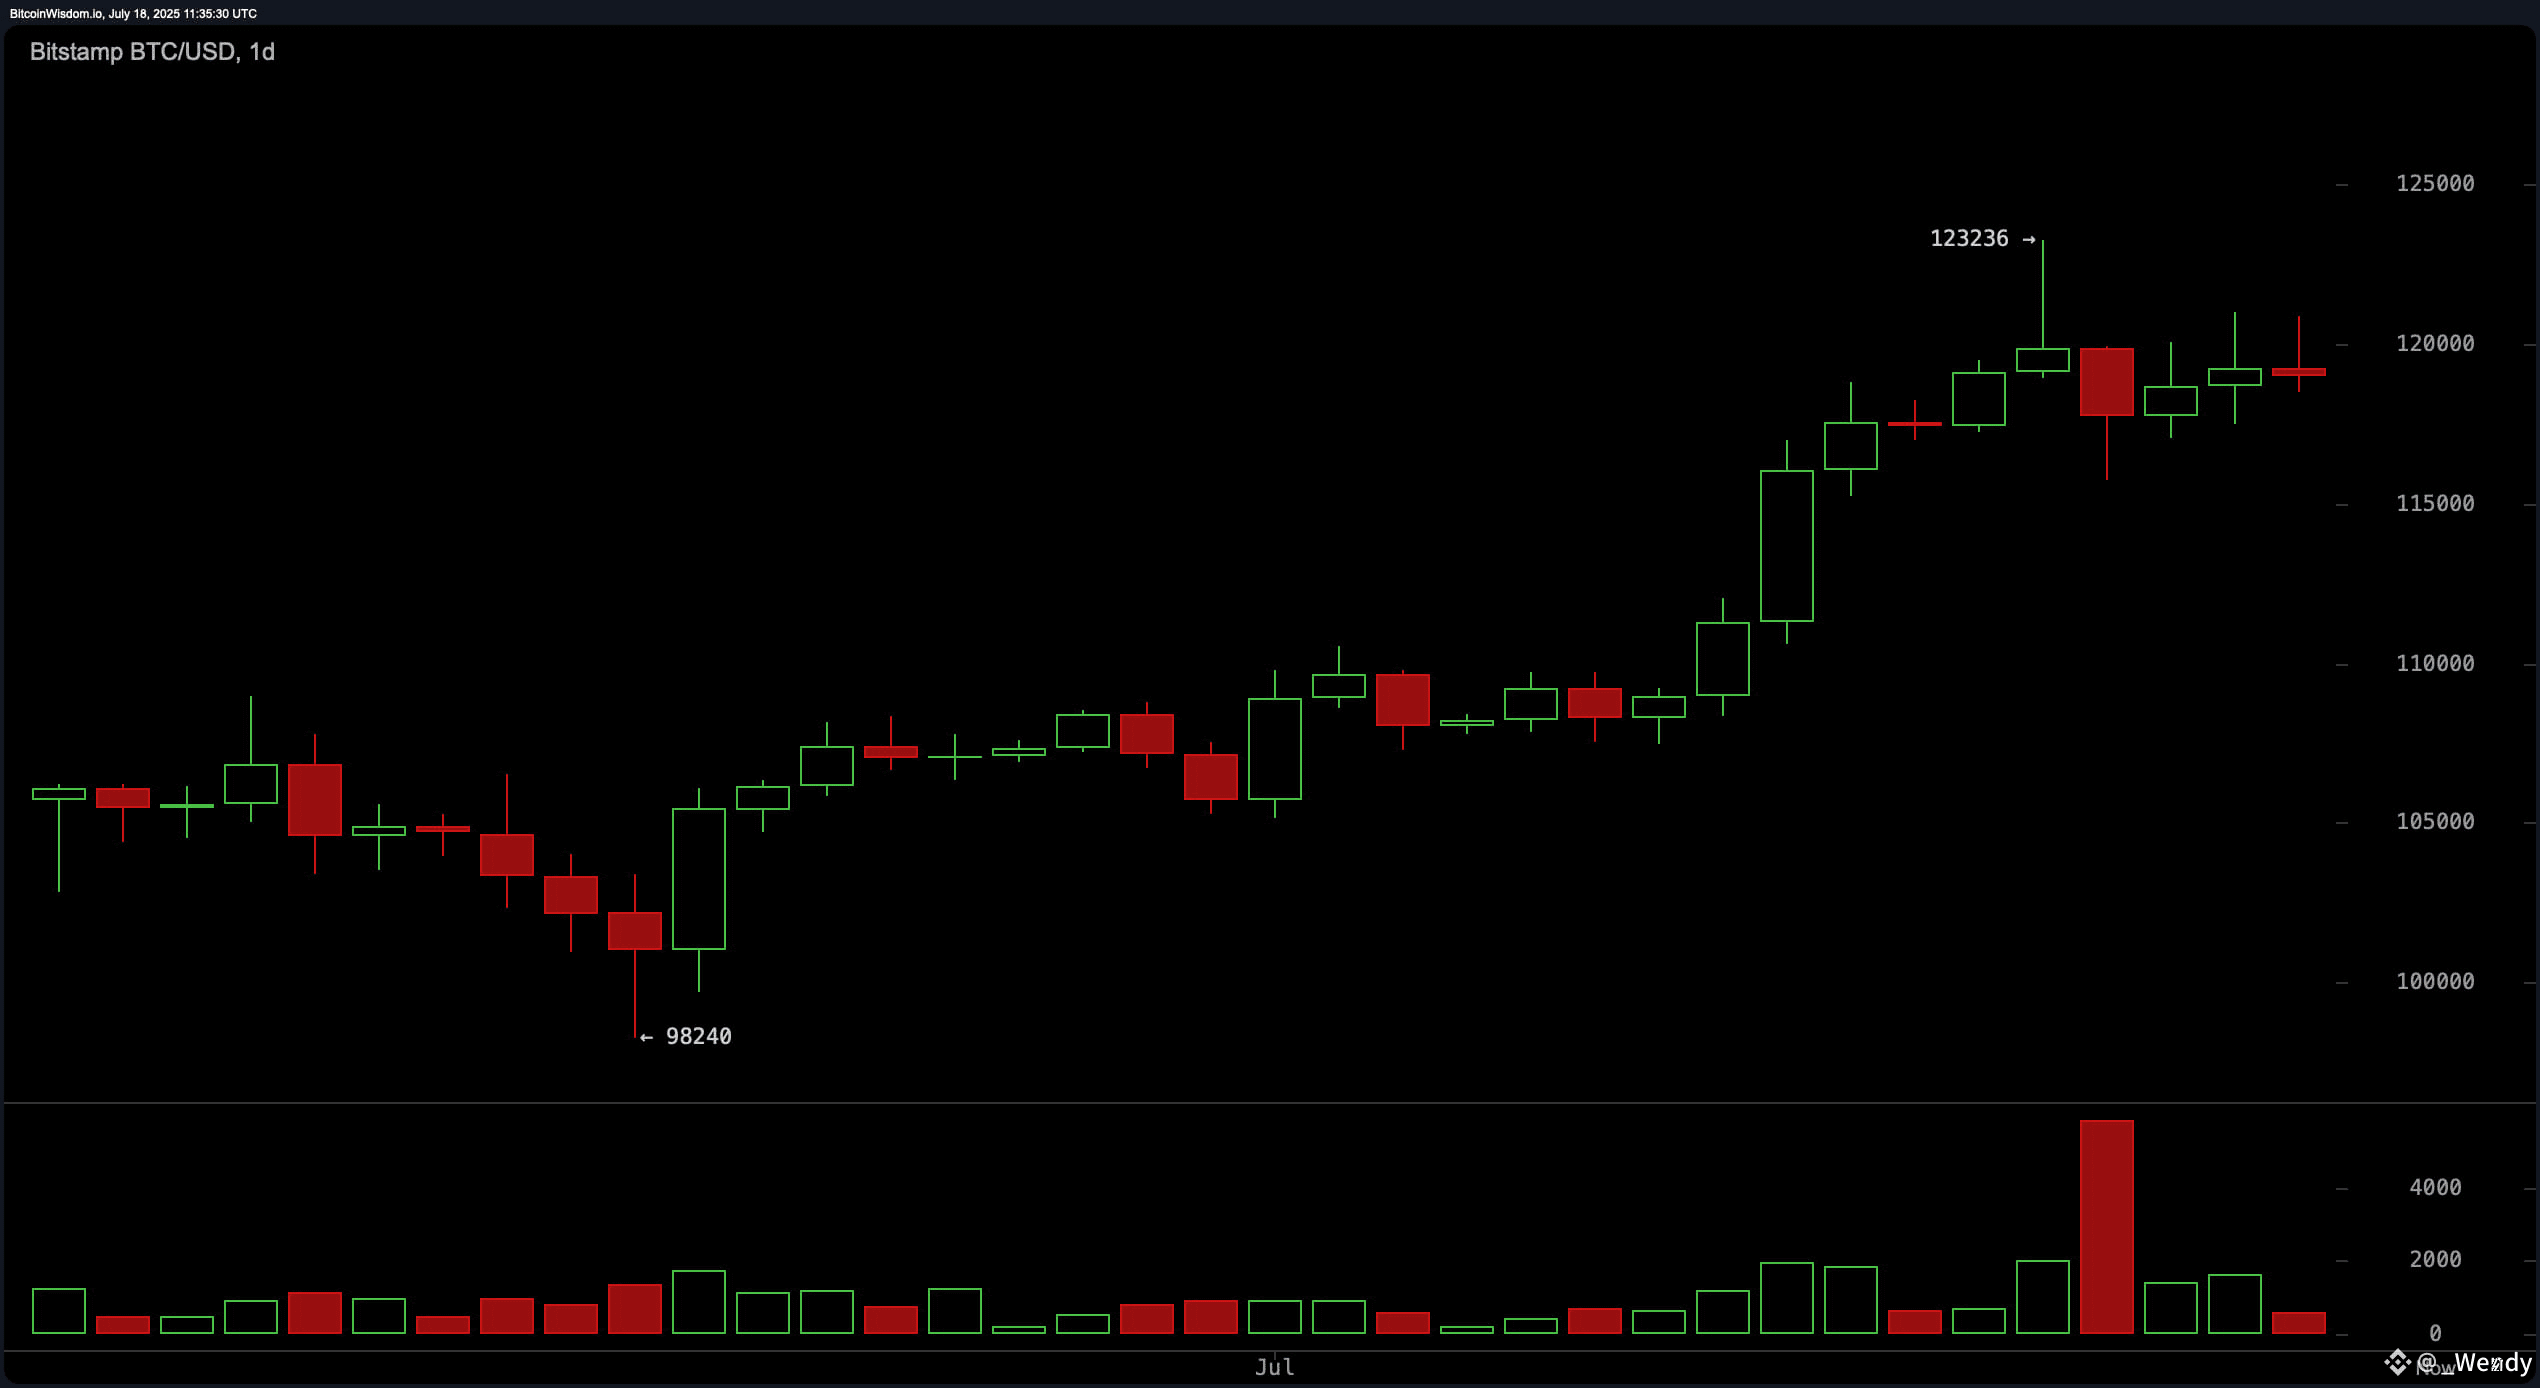
BTC/USD 1-day chart via Bitstamp on July 18, 2025.
On the 4-hour chart, bitcoin experienced a pronounced bearish rejection from $123,236 and quickly dropped to $115,729, followed by a minor rebound. Price action is currently confined within a range, reflecting short-term uncertainty. Momentum indicators, such as the average directional index (ADX) at 27 and the Awesome oscillator at 9,671, are also neutral.
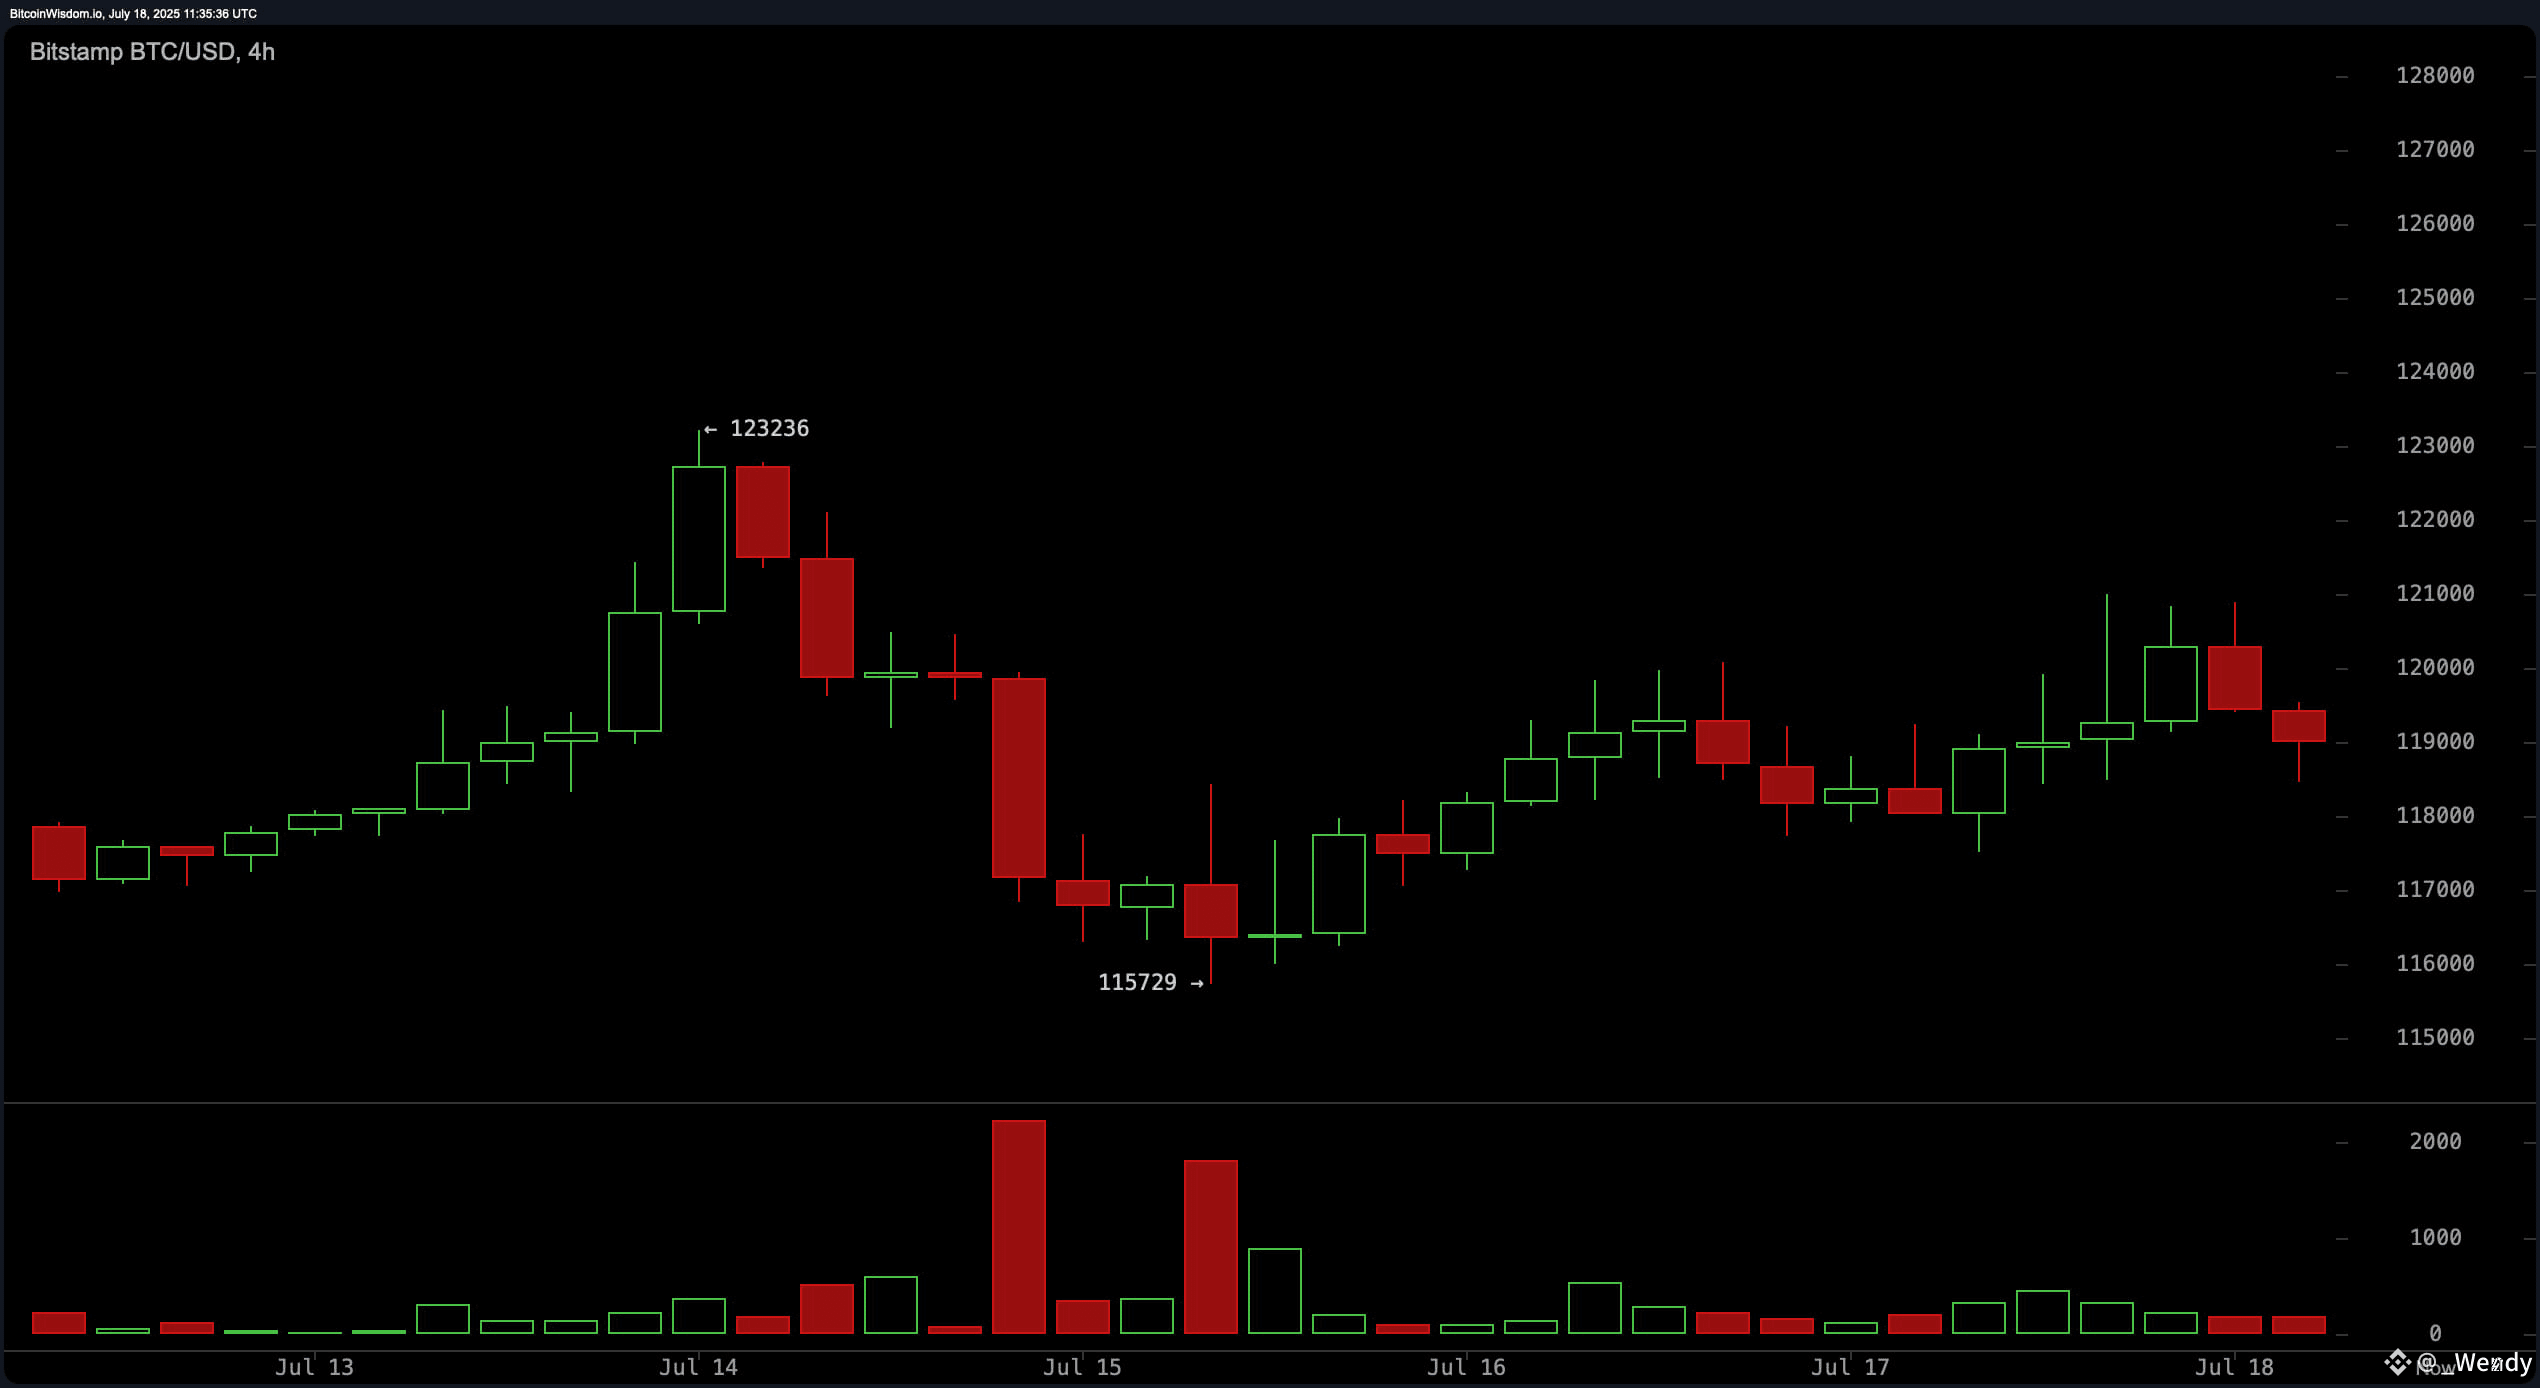
BTC/USD 4-hour chart via Bitstamp on July 18, 2025.
The 1-hour bitcoin chart displays clear evidence of a micro downtrend, with prices consolidating between $118,500 and $120,000. A volume spike and subsequent red candles around the $121,000 level signal strong selling interest at higher levels. Given that the momentum oscillator reads a bearish 10,053 and the moving average convergence divergence (MACD) indicator shows a bullish 3,445, conflicting signals underscore the current indecisiveness.
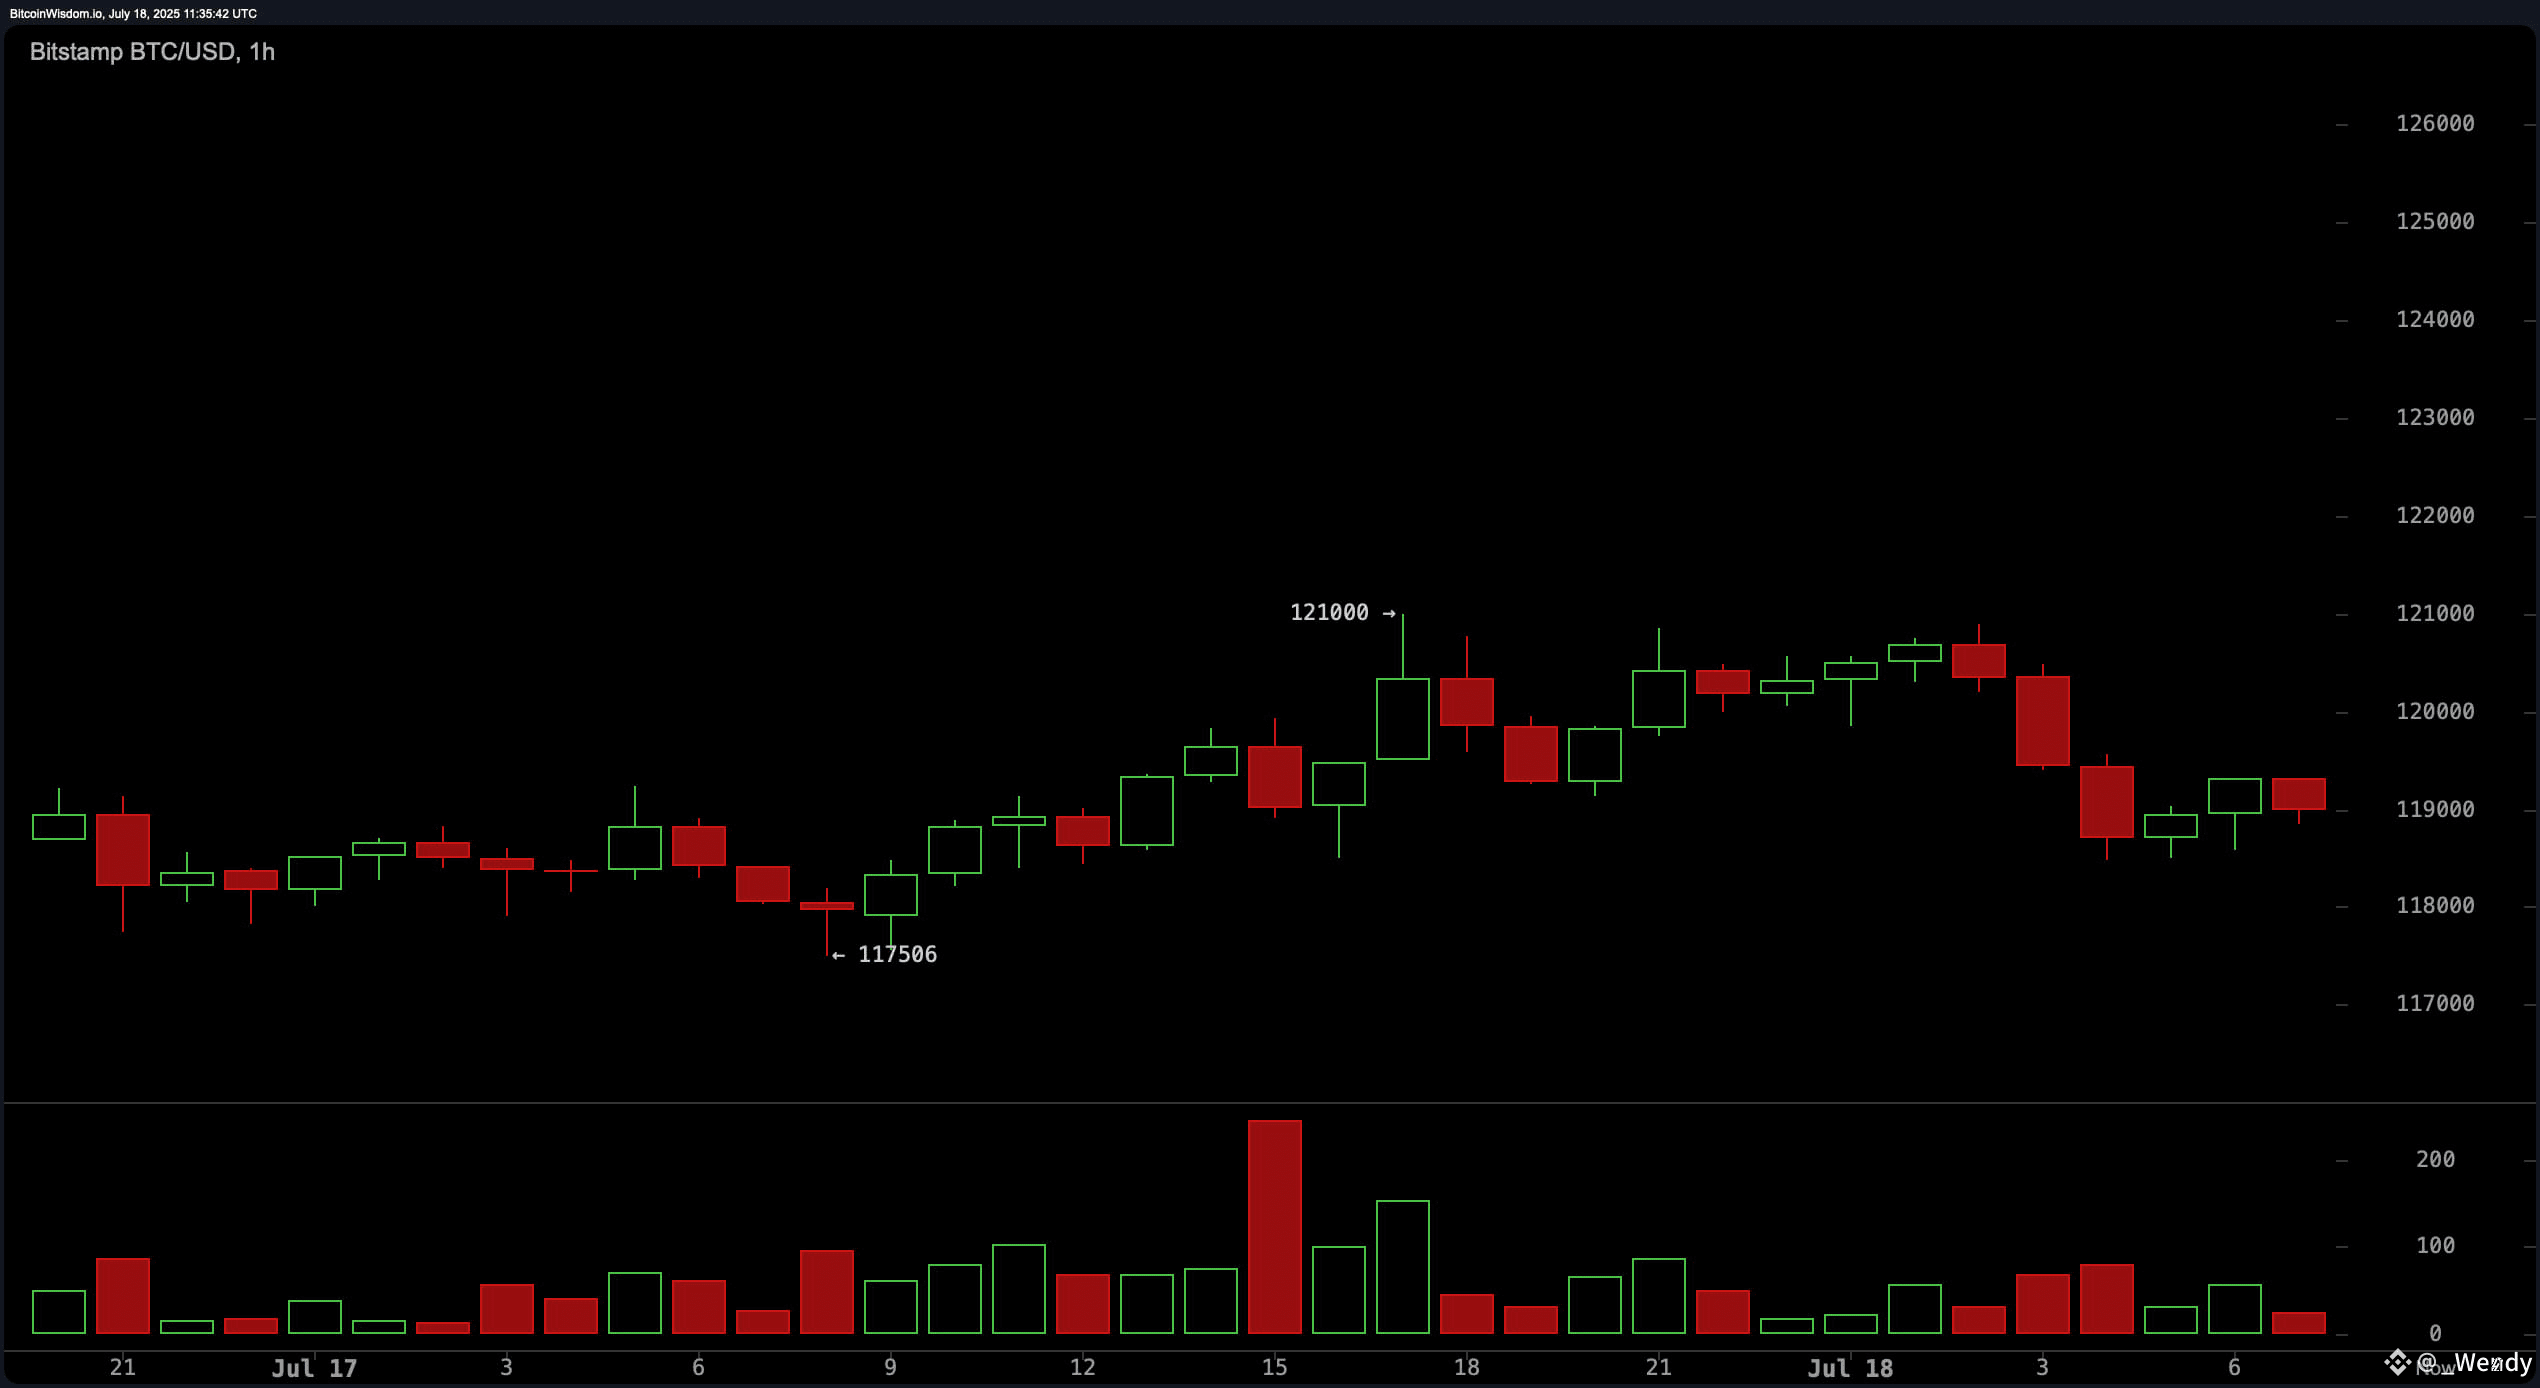
BTC/USD 1-hour chart via Bitstamp on July 18, 2025.
Moving averages (MAs) across all durations paint a decisively bullish longer-term picture. The exponential moving averages (EMAs) from 10 through 200 periods, as well as the simple moving averages (SMAs), all remain in positive territory. The 10-period EMA stands at $117,022, while the 200-period SMA trails at $97,621—indicating strong trend alignment in favor of bulls despite recent short-term pullbacks. This divergence between long-term bullish signals and short-term weakness calls for cautious optimism, especially as the price consolidates just above key support.
In summary, bitcoin’s overall trend remains bullish, though the asset is presently navigating through consolidation and potential distribution phases. Support lies at $115,700 to $117,500, while resistance is expected at $123,000. Traders should remain patient and await clearer signals, especially on lower timeframes, where intraday volatility could generate false breakouts. Whether price reclaims $120,500 or breaks below $117,000 will likely determine the next significant move.
Bull Verdict:
Bitcoin remains structurally strong in the broader trend, supported by consistent buy signals across all major moving averages. If price action holds above $117,500 and reclaims $120,500 with volume confirmation, the path toward retesting $123,000 remains open, reinforcing bullish momentum and favoring continued accumulation.
Bear Verdict:
Despite long-term bullish structure, short-term indicators point to weakening momentum and potential distribution near recent highs. A breakdown below $117,000 would likely confirm a deeper retracement phase, targeting support zones below $115,500 and potentially shifting market sentiment to a bearish outlook.
