1. BOLL indicator
The BOLL indicator was first used in the stock market, and it is also one of the important direction reference indicators in the currency market. How to judge the short-term direction through BOLL?
1. In a sideways state, the k-line walks in the middle and upper rail areas, "sell high and buy low", commonly known as high throwing and low absorption!
Buy low and sell high in the middle and upper rail areas of the k-line
2. In a sideways state, the K-line walks in the middle and lower rail areas, "buy low and sell high".
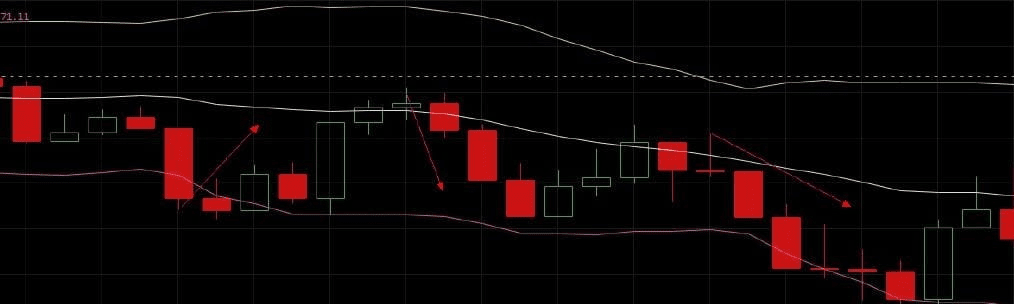
In the middle and lower rail areas of the k-line, the same tactics "sell high and buy low"
2. KDJ indicator
The KDJ indicator, known in the industry as the "random indicator", is another important reference indicator for short-term gameplay. How to judge the short-term trend through KDJ?
1. Golden cross, representing a short-term upward trend. How to judge whether it is a golden cross? After the white K-line forms a cross with the golden D-line, the white line moves above the golden line, indicating a clear short-term bullish trend!
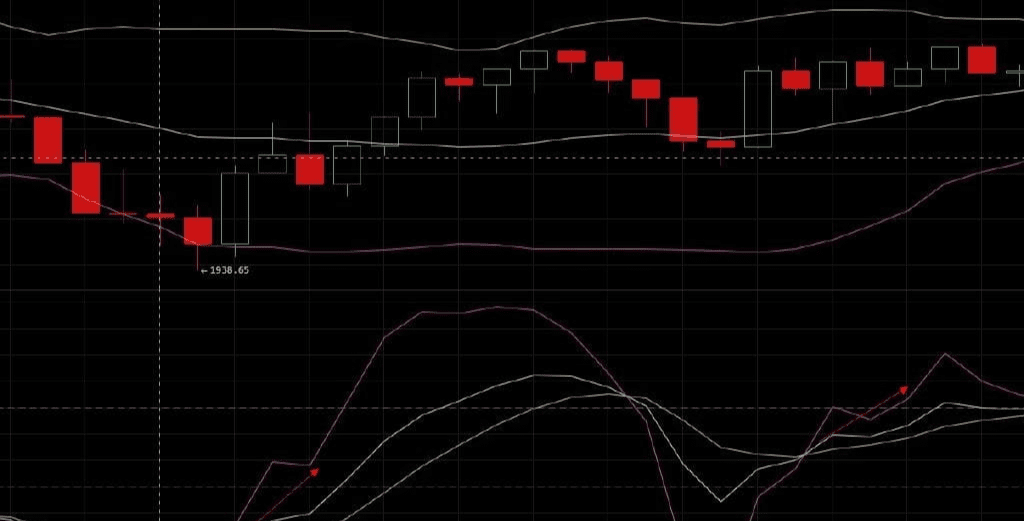
Golden cross illustration
2. Death cross, representing a short-term downward trend. How to judge? When the white line crosses the golden line, and the white line runs below the golden line, it indicates a clear short-term shorting trend!
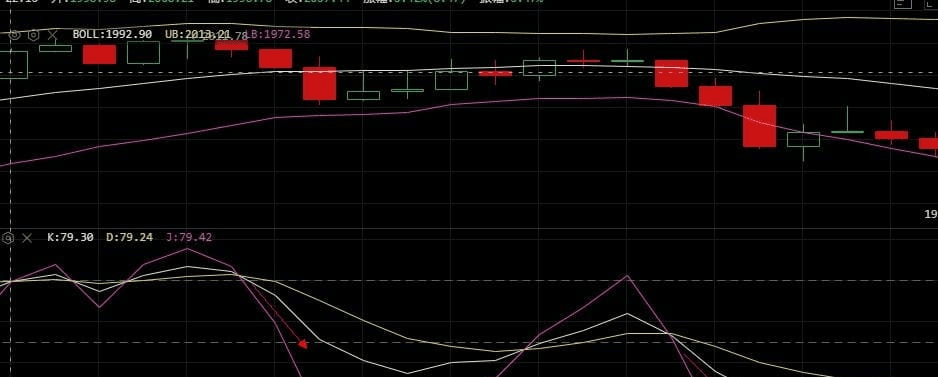
Death cross illustration
How to accurately predict the rise or fall with the greatest probability, combining the BOLL and KDJ trends at a glance!
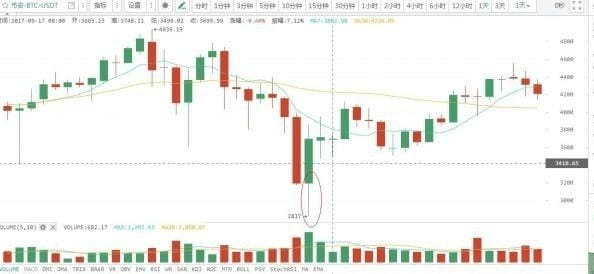
Beginner's guide to reading K-line charts in the currency circle (K-line chart formula for the currency circle market)
The K-line represents Yin and Yang, prosperity leads to decline, and adversity leads to prosperity, which is a universal law of nature and human society. The currency circle is also the same. Good things will turn to bad when they reach the extreme, and vice versa. Bad things will turn to good when they reach the extreme. This is the origin of everything, the result of Yin and Yang game. The K-line is not the only one, but to survive in the market of the currency circle, leeks must combine actual combat, self-improvement, polishing, and improve themselves.
K-line basics
The K-line chart is also called the candlestick chart. This chart originated in Japan during the Tokugawa shogunate and was used by rice market merchants at that time to record the market conditions and price fluctuations of the rice market. Later, it was introduced into the capital market because of its delicate and unique drawing method.
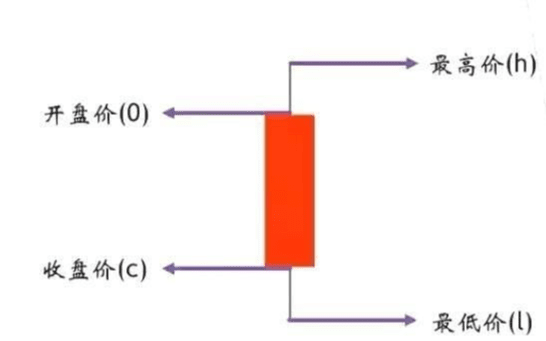
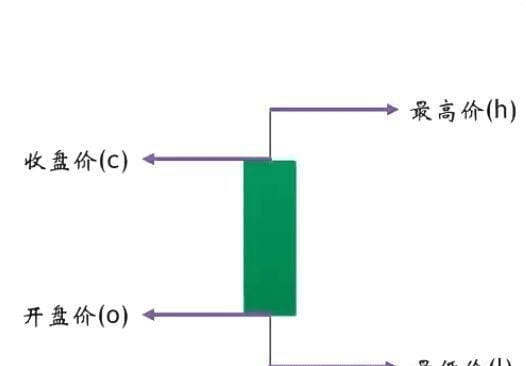
The K-line is drawn based on the opening price, highest price, lowest price and closing price of each analysis cycle. The structure of the K-line can be divided into three parts: upper shadow line, lower shadow line and middle entity.
In the digital currency market, green represents positive and red represents Yin line. Through the K-line chart, we can completely record the market conditions of each analysis cycle. After a period of consolidation, the currency price forms a special area or shape on the chart. Different shapes show different meanings. We can explore some regular things from the changes of these shapes. Generally speaking, K-line graphics can be divided into reversal patterns, consolidation patterns, gaps and trend lines, etc.
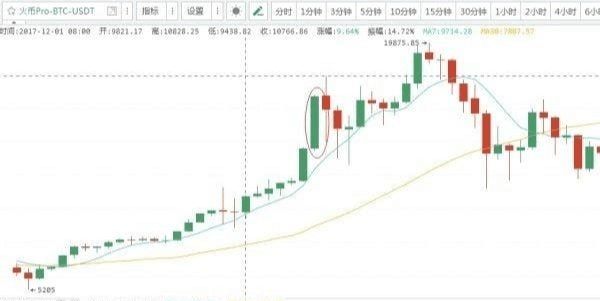
The practical significance of K-lines
In currency trading, K-line chart is the most intuitive analysis tool. A falling leaf knows the autumn, this is the way of thinking that K-line chart brings us, simple K-line reminds us, no matter how the currency circle runs, we can find clues from the details. Whoever can grasp the clues drawn by the K-line faster and more accurately can avoid more losses and thus obtain greater profits.
In fact, different people have different "views" on K-lines. Therefore, the same K-line chart is placed in front of many investors, and many different results are "analyzed". It is precisely because of this result that the game in the currency circle is more intense. Sometimes, when you do quantitative trading or trade more, you slowly find that K-lines are often deceiving and atypical. So I am troubled every day, how can this be? It shouldn't be! In theory, it should go this way and that way! Gradually began to doubt K-lines, study dealers, study false breakthroughs, etc. Conspiracy theories fill the entire precipitation stage. Sometimes, maybe it's luck, a few accidental contrarian or imaginary moves, and you catch a few waves, as if you have really found the true meaning behind K-lines and think you really have mastered the pulse of the market. But more often, like the previous stage, you still can't get a good result after quantification. Many people die in this stage, standing still and hesitating. But when you really get past it, you will find that whether you believe it or not, the K-line runs like that. Whether you do it or not, it is there. He is not a god, nor is he garbage. He is just a witness to the market's running track. There is no need to myth him, nor is there any need to despise him.
The interpretation of K-lines has become increasingly complex, because with the progress of the investment group and the increase of investment funds, the short-term K-lines in the market are often manipulated and there are "traps". Therefore, we need to use the principle of relativity and technical analysis methods to filter. The principle of relativity includes quantitative measurement standards and analysis work, so that we can improve the probability of successful analysis and operation. If there is no K-line chart, investment is still investment, the road is still tortuous, and other methods can still be used. But in the face of the investment reality we are in, the thinking of K-lines cannot be ignored, because to some extent it is one of the starting points of real investment.
Many people also firmly believe that the premise of K-lines is: the market is always right. Therefore, when you see a certain K-line pattern, because the market is always right, the current K-line will also reflect the future trend of the market. In fact, I believe that many people who have just started trading will have a question, why is it that when the market has a perfect technical pattern, it often goes against expectations? This is not that the technology itself is wrong, nor is it a problem with the people who use it, it's just that we often only see the "perfect" technical pattern, we only see what we think is right.
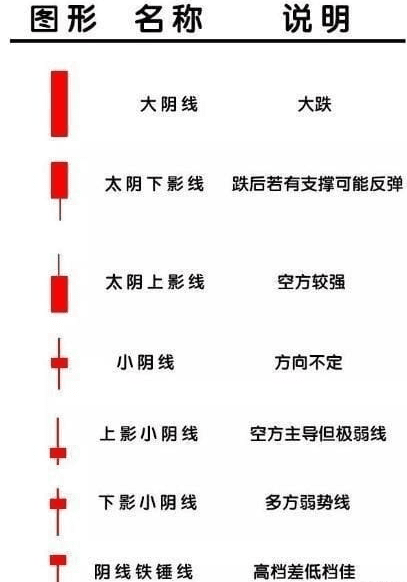
Analysis of various basic patterns of single K-lines
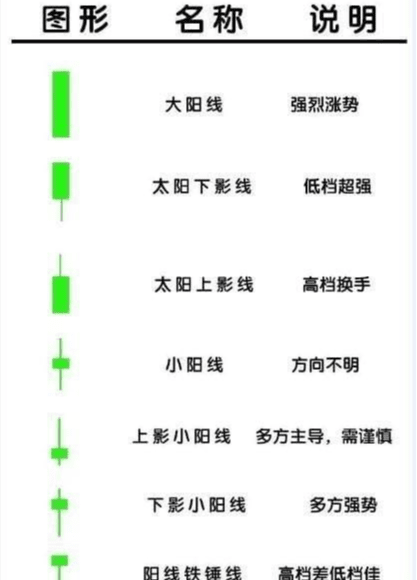
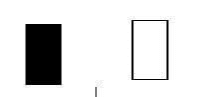
Looking at Yin and Yang is to look at the direction. Taking the Yang line as an example, after a period of long-short game, the closing price is higher than the opening price, indicating that the bulls have the upper hand. According to Newton's law of mechanics, the price will continue to run in the original direction and speed without external force. Therefore, the Yang line indicates that it will continue to rise in the next stage, at least to ensure the inertial upward rush in the early stage of the next stage. Therefore, the Yang line often indicates a continued rise, which is also in line with one of the three major assumptions in technical analysis that the stock price fluctuates along the trend, and this trend is also the core idea of technical analysis. Similarly, the Yin line continues to fall.
Look at the size of the entity
The size of the entity represents the internal driving force. The larger the entity, the more obvious the upward or downward trend. Conversely, the trend is not obvious. Taking a Yang line as an example, the entity is the part where the closing price is higher than the opening price. The larger the Yang line entity, the more sufficient the upward momentum is. Just like the physical principle that the larger the mass and the faster the speed of an object, the greater its inertial impulse, the larger the Yang line entity represents its greater internal upward momentum, and its upward momentum will be greater than the Yang line with a small entity. Similarly, the larger the Yin line entity, the more sufficient the downward momentum.
Look at the length of the shadow line
The shadow line represents a turning signal. The longer the shadow line in one direction, the more unfavorable it is for the stock price to move in that direction, that is, the longer the upper shadow line, the more unfavorable it is for the stock price to rise, and the longer the lower shadow line, the more unfavorable it is for the stock price to fall. Taking the upper shadow line as an example, after a period of long-short struggle, the bulls finally lost their integrity and retreated. Once bitten by a snake, ten years afraid of well rope. Whether the K-line is Yin or Yang, the upper shadow line part has formed the upper resistance in the next stage, and the probability of the stock price adjusting downward is high. Similarly, the lower shadow line indicates that the probability of the stock price attacking upward is high.
What is the long-short battle often said in the currency circle?
Long and short are two legions, the long side represents the green legion, and the short side represents the red legion. The two sides have different views. The long side believes that it will rise, and the short side believes that it will fall, so there are often battles. The long side green legion is a group of people who are bullish on the price. They will buy in and raise the price. The short side red legion is a group of people who are bearish on the price. They will sell, causing the price to fall.
Battles will occur every time period. If the short red army wins, the price will fall, and the K-line chart will show red. If the red side gains a huge advantage, it means that the power is strong, and the entity displayed by the K-line chart will be larger. If the green side's resistance is weak, it means that the resistance to the red side is too small, and the shadow line displayed by the K-line chart will be very short.
Analysis of various basic patterns of combined K-lines
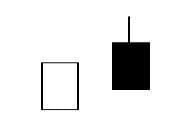
Dark Cloud Cover Pattern
After the price rises on the Yang line, a Yin line appears, and the Yin line causes the price to fall below 1/2 of the previous Yang line entity. This combination often appears when the market has risen a lot, or even hit a sky-high price, indicating a reversal of the market, followed by a downward trend.
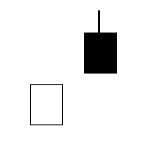
Island Pattern
After a period of rising market, a gap-down Yin line appears, shaped like an island. This combination, although the closing price of the Yin line is still higher than yesterday, it can be seen that the mentality of market participants is weak and the operating methods of early profit-takers, indicating that the market outlook is not optimistic.
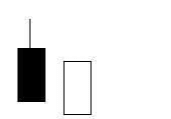
Pillar Pattern
This combination is relative to the "Dark Cloud Cover" combination. After the price appears Yin line falling, a Yang line appears again, and the Yang line raises the price to more than 1/2 of the previous Yin line entity. This combination often appears when the market has fallen a lot, or even hit a low price, indicating a reversal of the market, followed by a rising market.
Engulfing pattern
The entities are Yin and Yang, but the long entity of today completely encompasses the small entity of yesterday, indicating that the market outlook will develop in the direction of the long entity.
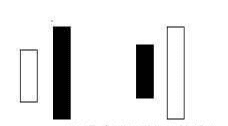
Harami pattern
The entities are Yin and Yang, but in contrast to the encompassing combination form, it is today's small entity that is encompassed by yesterday's large entity, shaped like being pregnant in the womb, hence it is called the harami pattern. I don't know if it has anything to do with heredity. This harami pattern indicates that the direction of the market outlook is often the direction of the mother, that is, Yang gives birth to Yin, and Yin gives birth to Yang.
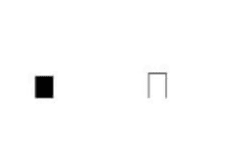
Morning Star Pattern
This combination is after the Yin line, a small Yang line or a small Yang cross line appears below, followed by a gap-up large Yang line. This combination often appears after a long decline or a long sideways market. At this time, the small Yang line below is like the long-awaited morning star in the minds of market participants. The subsequent strong upward Yang line shows that the long night has passed and the market has ushered in the light. Therefore, the Morning Star combination has become the turning point for the market to reverse and rise.
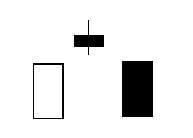
Evening Star Pattern
This combination is the opposite of the Morning Star combination and becomes the turning point for the market to reverse and fall. The gap-up cross at the top finally becomes an evening star after the gap-down large Yin line appears. If the top is an inverted T-line with a medium and upper shadow, this combination is also figuratively called a "shooting star"
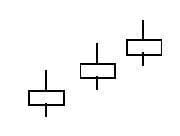
Three Red Soldiers Pattern
When this combination of three consecutive small Yang lines rises in the low range, it indicates that the market has come out of the long-term downward shadow and embarked on a rebound and upward journey.
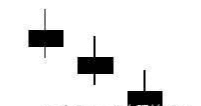
Three black pawns combination
When this combination of three consecutive black pawns falling in the high range, it indicates that the rising market has ended and the falling market has begun.
Describing the market with K-lines has a strong visual effect and is one of the charts that best expresses market behavior. Even so, some common K-line combination patterns are just some typical shapes summarized based on experience, without strict scientific logic. Remember the following points when applying K-lines.
1. K-line combination analysis will have a certain error rate. The market changes are complex, and the actual market situation may be different from our judgment. The results of empirical statistics can prove that the success rate of using K-line combinations to judge the market outlook is not very high.
2. K-line analysis methods must be combined with other methods. After using other analysis methods to make the decision whether to buy or sell, use K-line combinations to choose the specific time and price to take action.
3. According to the actual situation, constantly "modify, create and adjust" the combination form. The combination form is only the product of summarizing experience. In the actual market, it is rare to fully meet the K-line combination form we introduced. If you copy the combination form unchanged, you may not encounter a suitable opportunity for a long time. You should appropriately change the combination form according to the situation. You should understand the internal and external principles of each combination form. Because it is not a perfect technology, this is the same as other technical analysis methods. K-line analysis is based on human subjective impressions and is one of the analysis methods based on expressing historical form combinations.
What is the reason that causes most traders to lose money in the field of trading? (with illustrations)
Simplify complex problems
Today, let's talk about the headache events in trading, which everyone must have experienced
For example:
1. The order is stopped loss multiple times, and then it rises or falls according to the predicted direction
2. Often do reverse orders
3. Often trapped in the middle, neither cutting nor leaving
And so on, today we will only pick these few simple topics to chat about
The first question
After the order is stopped loss multiple times, it falls according to the predicted direction
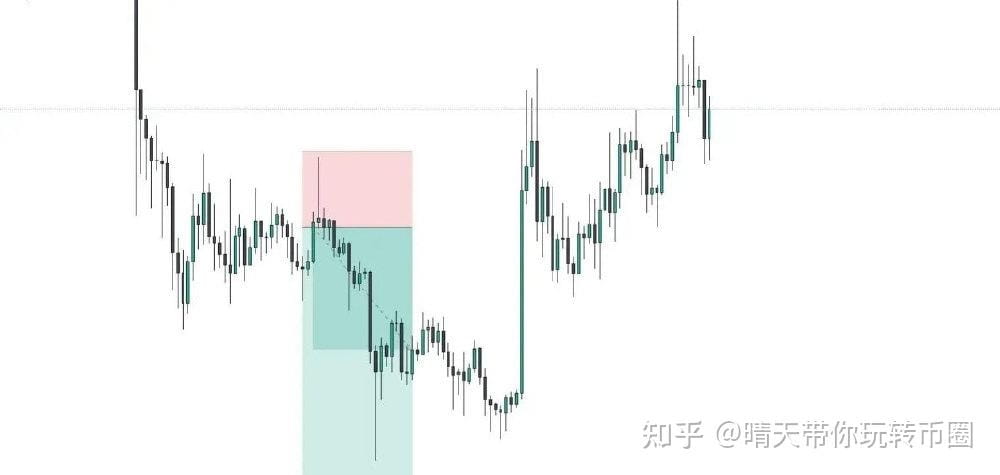
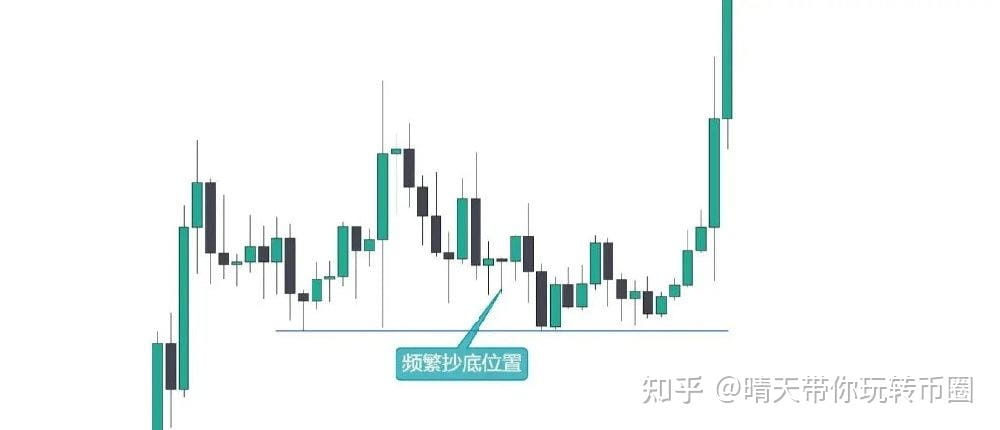
This generally occurs when you first enter the industry. You always want to buy the bottom and touch the top, constantly wearing down the position principal. After the position principal is gone, the price rises or falls as expected according to your prediction, but you don't have the principal. So, let's use actual cases to show it below.
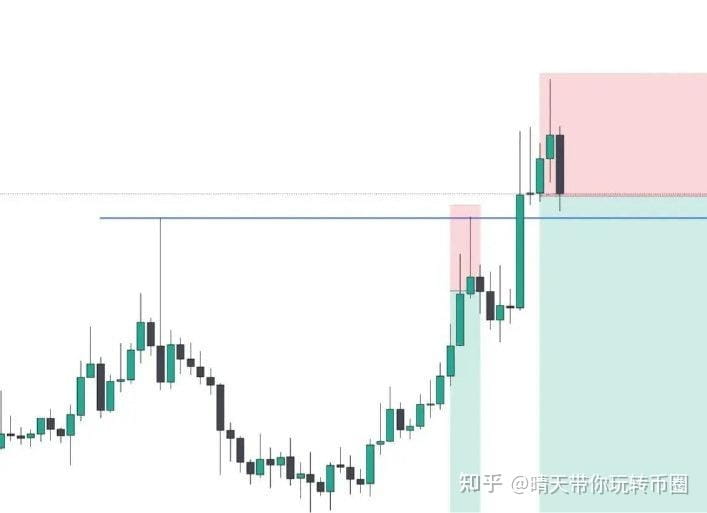
Enter the market when you see a double bottom, and it also gives a signal to enter, thinking that I can buy the big bottom
The price did rise afterwards
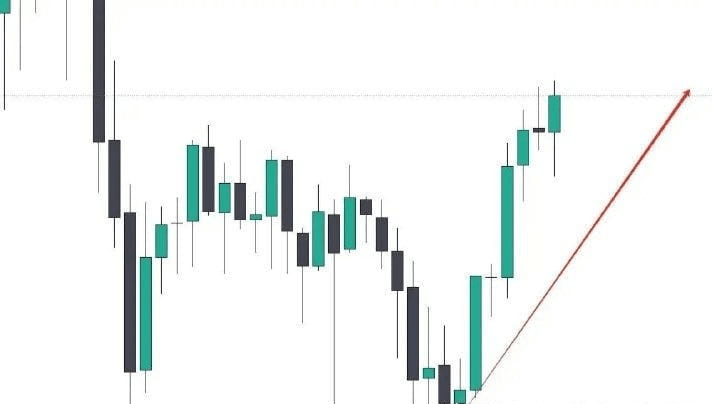
But as time changes, you don't pay attention and it comes down, stopped loss
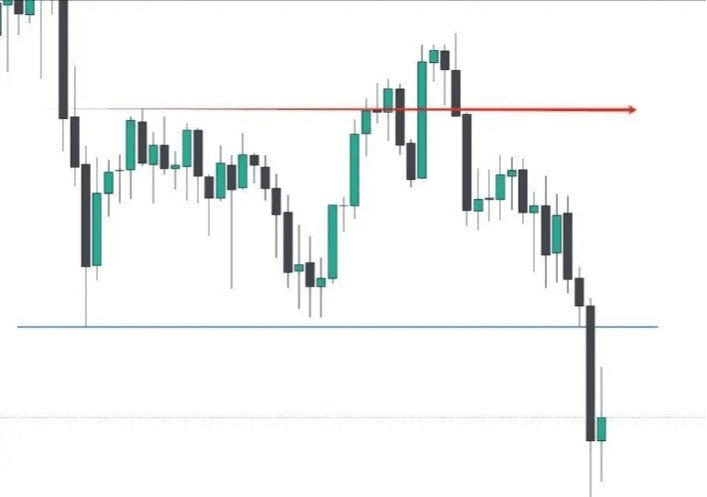
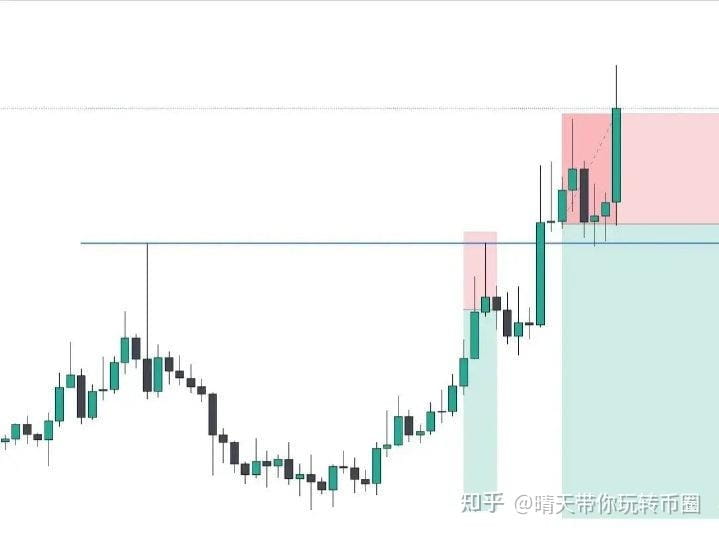
Then the price was supported at the low point again, and I went in again
After a while, it was stopped loss again
At this time, the mentality also collapsed, the money was gone, and the market took off later
Is the image not brothers?
The second often does reverse orders
These are things that everyone will definitely do, but they don't know it at the time
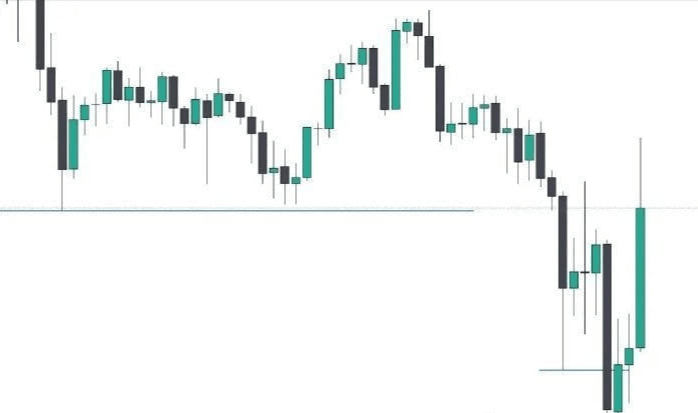
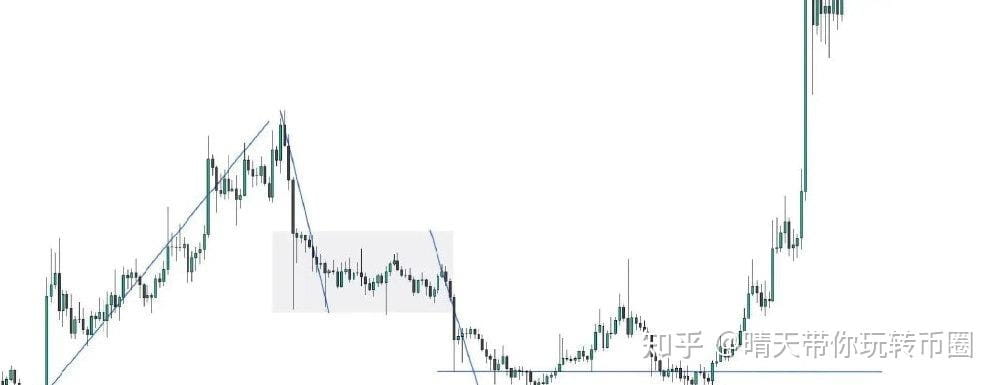
For example, here, the pressure level also gives a bearish signal, thinking. This time I can finally get a big order
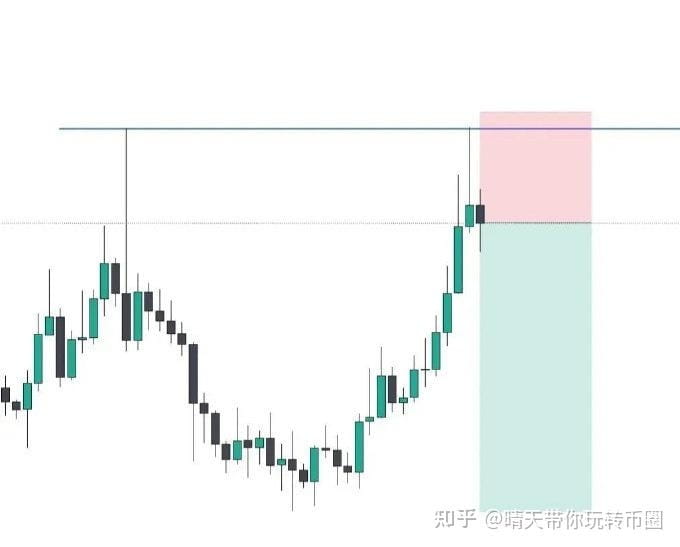
Stopped loss as soon as I entered the market
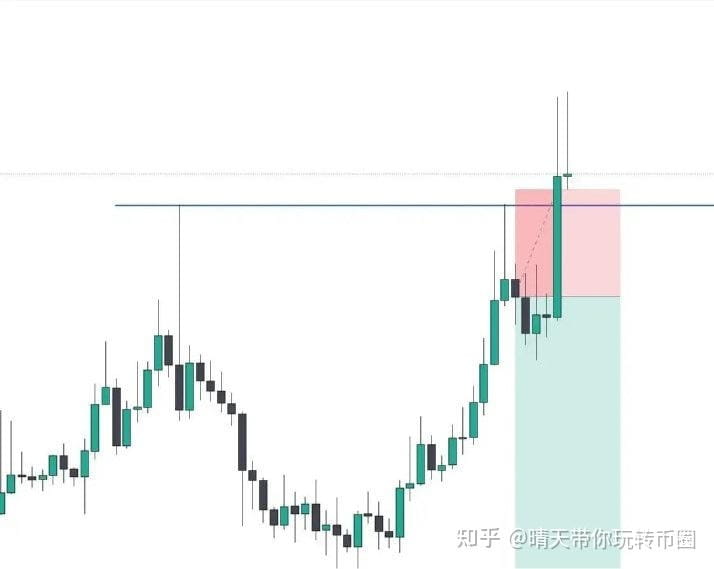
Regardless of any signal or no signal, I entered a short order again. This time, you should come down, right? Feeling good.
Then the big Yang line stopped loss again, and after repeated stop losses, the more the whole, the more on the head
Brothers, is this the case? When you first started placing orders, was it like this?
The third type is often trapped in the middle, neither cutting nor leaving
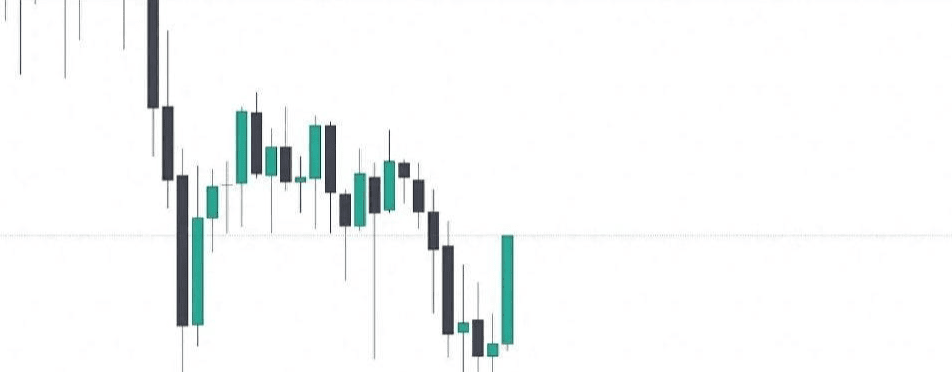
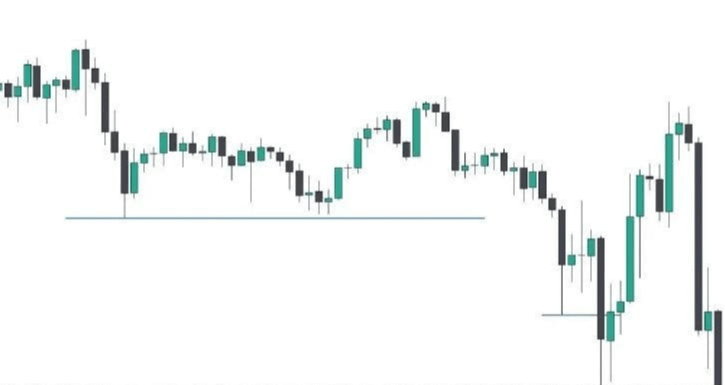
I made a short order at this position, without setting a take profit or a stop loss
First there is profit, then there is constant loss
The set is very uncomfortable, I can't eat well or sleep well, it's uncomfortable to hold it, and it's uncomfortable to lose it, it's uncomfortable no matter what
These three types, I think everyone who trades has experienced them. If you are still experiencing them now, then you should read the following content carefully
The first type is that the order is stopped loss multiple times, and then it rises or falls according to the predicted direction
In fact, I don’t understand what the market is doing. To put it bluntly, making money or losing money is gambling. If you bet right, you make money, and if you bet wrong, you lose money. Anyway, you are either buying the bottom or touching the top.
Most of these situations don't have any technical analysis. They enter the market as soon as they see the signal for the entire support and pressure level
Regardless of the current price position, enter when you see a double bottom.
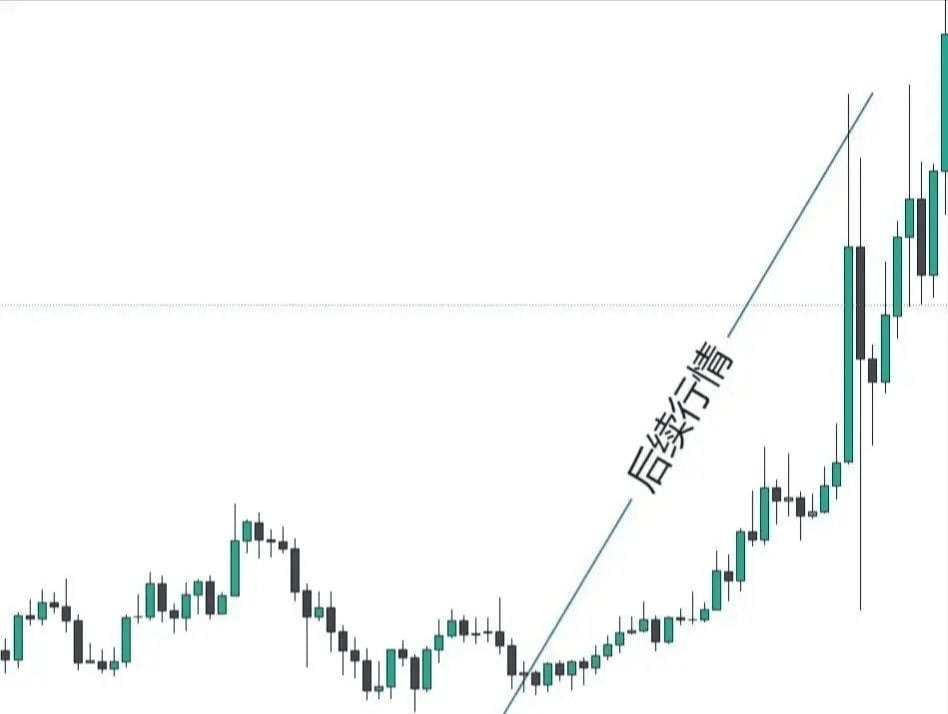
Although we are trading a high probability event, not a 100% event, learning technical analysis will definitely allow you to avoid this problem, such as the order just now
In fact, it has not been adjusted in the big cycle, and it has not reached the key position. The position of buying the bottom is not the position where the price reversal will occur
The second type often does reverse orders
I can't tell what the trend is. Anyway, I enter the market as soon as I see the signal for the support and pressure level
In fact, the price has already reversed to a bull market, but you are still a short-selling mindset, leading to always doing reverse orders
The third type is often trapped in the middle, neither cutting nor leaving
This point is actually greed, or it can be understood as not having a clear understanding of the current market, not knowing what level of order you are doing, what stage this order is at this level, and the worst point is that you don’t like to set stop-profit and stop-loss. Always want to eat a big bite, but the big one is not eaten, and is backlashed.
These are common occurrences when trading, but as long as you study technical analysis well and learn position management and allocation well, these two points are done very well, which can solve 80% of the problems of communication and psychology, but many people know where their problems lie but don't want to change, which makes it difficult to succeed.
It's like you're drowning. In fact, the water is only up to your knees. Because you are lying down, you feel that the water is drowning your neck. If you struggle a little, you will die. You are very scared, so you have been lying flat. But in reality, the water is not that deep. As long as you stand up, you will know that the water is only up to your knees.
Many people trap themselves to death. Finally, they are eliminated by the market and lose a lot of money.
If you want to achieve something in trading, you need to constantly learn, change your cognition, find problems, and solve problems, so that you can slowly become a stable professional trader. I hope everyone can find their own problems, face them directly, solve them and make profits as soon as possible. Finally, I wish you all smooth trading.
So how do retail investors make money?
Perhaps many people will say that short-term looks at technology, and long-term looks at logic. In essence, short-term depends on emotions, and long-term depends on value. Value itself also has emotions, just like Bitcoin can be hyped to 70,000, and can fall back to 15,000. It is not that the value of Bitcoin has changed, but the market's emotions have changed. Bitcoin is still the same Bitcoin.
Therefore, the long-term investment value also needs to understand the market sentiment. As for short-term trading, the so-called K-line technology itself is a portrayal of market sentiment. How the main funds draw the K-line completely depends on the overall market sentiment, whether there are funds to follow suit, and whether there is market popularity. It can be said that what you see and hear on the K-line is what the funds want you to see, not the natural formation of trading. The ultimate portrayal of emotions is the trading volume.
Therefore, the rise and fall of any cryptocurrency is ultimately written on the trading volume. There can be a price only with volume, and there is no way to go downhill without volume.
The first step for retail investors to resist emotions is to understand the trading volume, and only participate when there is volume. The principle is very simple. Volume means that there are funds in operation, and no volume means that funds are also abandoned for cryptocurrencies in the short term.
Why do short-term speculations focus on hot spots? Because only when funds gather can there be a profit-making effect. Even long-term bull coins and value investing are actually accompanied by volume. In the consolidation period of low volume, it is also necessary to continue to wait and see. Retail investors must resist emotions and understanding trading volume cannot solve the problem. They must have their own trading principles.
The second step for retail investors to resist emotions is to set clear buying and selling conditions. Many currency people speculate in coins, which is really arbitrary, buying when they want to buy and selling when they want to sell.
The buying point is basically when the cryptocurrency has risen sharply, and if you don't buy it, it will take off. The selling point is basically when the cryptocurrency has fallen sharply, and if you don't sell it, you will be deeply trapped. The emotion of chasing rises and killing falls is inherent, and it is also derived from the collapse of retail investors' mentality and emotions under the violent fluctuations of the market. Retail investors must resist emotions, stop buying and selling arbitrarily, and clarify their buying and selling points. Under what circumstances to choose to buy and under what circumstances to choose to sell, there must be a clear principle, decided before holding a position, and do not make a temporary decision.
The third step in resisting emotions is to understand patience and abandonment. In the mentality of retail investors, there is also a link that is the weakness of human nature, which is regret.
You will regret why you didn't sell at that time, leading to the decline in the currency price and causing losses. You will regret why you didn't buy at that time, leading to the soaring of the currency price and causing you to miss out. Retail investors need to learn to be patient, and what they need to be patient with is floating losses.
As long as the investment logic does not change, floating losses, etc., are all necessary to accept, which is one of the situations that will definitely occur on the road of investment. No one can just buy at the lowest point. Retail investors need to learn to give up, and what they need to give up is stepping into the air.
As long as the cryptocurrency does not meet its own investment logic, even if the currency price keeps rising, you cannot follow the trend and buy it. You must know how to give up. Give up those rises that are not within your cognitive range.
Cold-blooded people are more likely to make money in cryptocurrency trading, because without emotions, it is the only way to survive in the market.
I am Qing Tian, an old player in the currency circle who expects you to return fully loaded. If you are eager to dive deep into the currency circle, but are confused about the starting point and eager to get started, you may send me a private message. At the same time, welcome to follow the official account (Encryption Circle Qing Tian) to get more free information. I adhere to principles, stay away from contract traps, capital market temptations and pyramid schemes, and only hope that our encounter is full of positive energy and warmth.
The currency circle, this unpredictable but infinitely potential stage, every decision may lead you to the other side of wealth. I am well aware of the hardships and challenges, so I always adhere to the bottom line and explore this tempting land with caution and courage. If you also have dreams and pursuits for the currency circle, then let us work together and create brilliance!
