
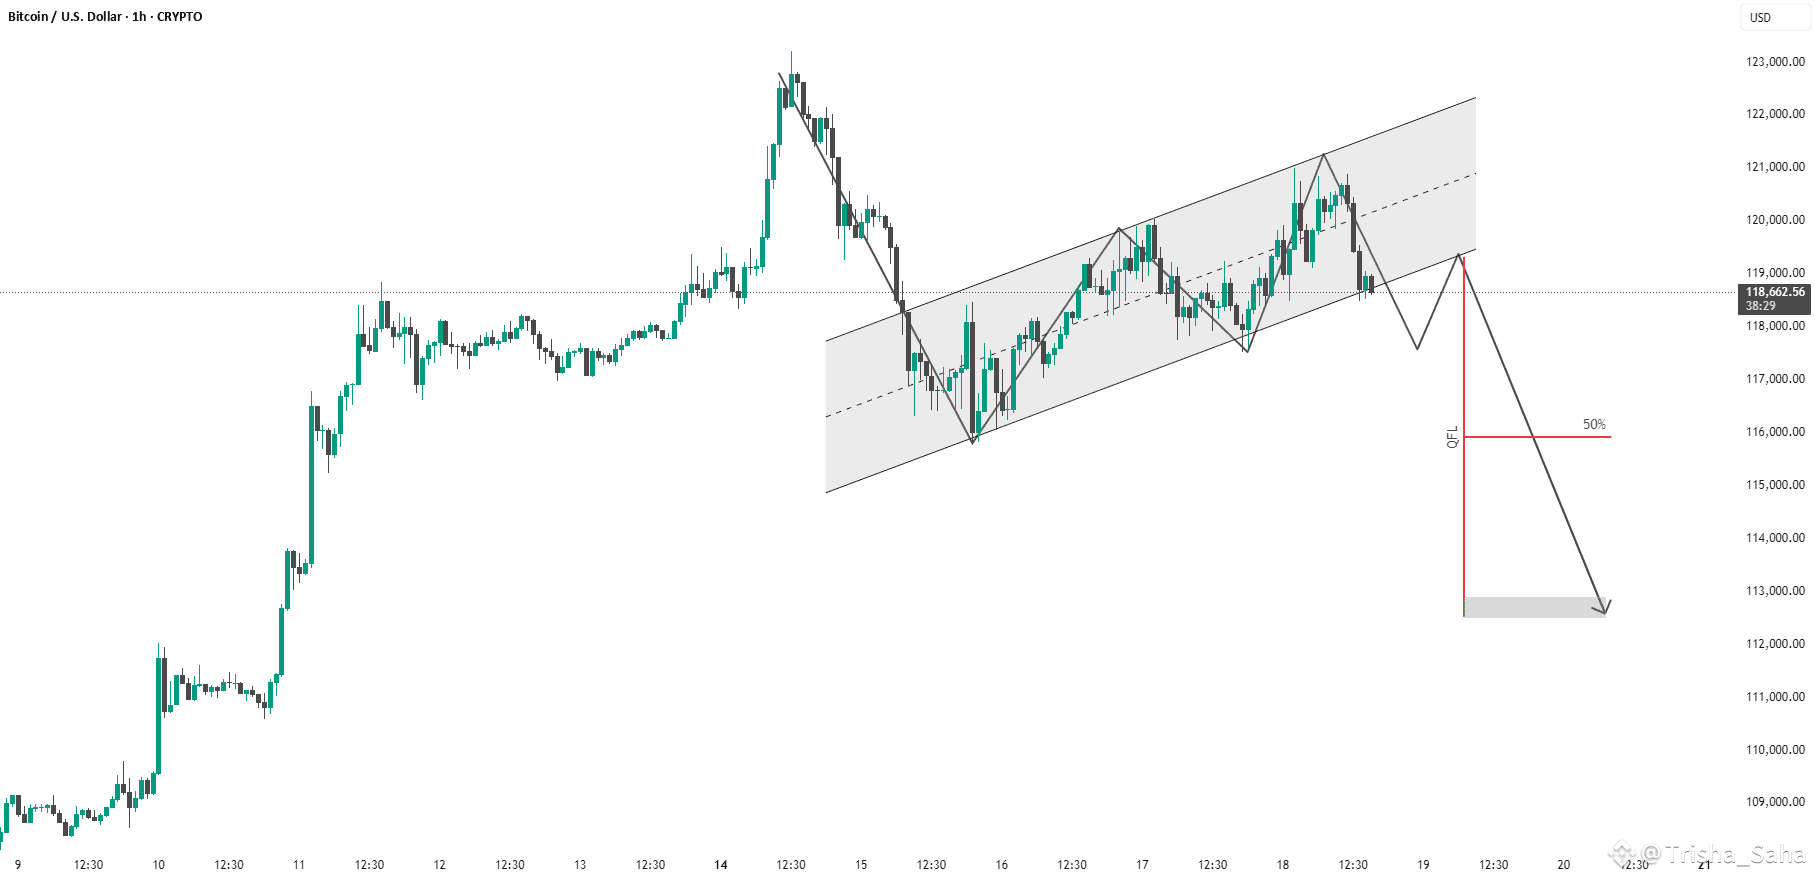
This is a 1-hour chart of Bitcoin (BTC/USD) with a clear bearish outlook indicated by the analysis:
Key Observations:
Rising Channel:
Price has been moving inside an ascending channel.
Currently testing the lower boundary, suggesting potential for a breakdown.
Price Projection:
A sharp drop is anticipated after breaking the channel, supported by the downward black arrows.
The analyst anticipates a retest of the lower boundary followed by a rejection and continuation downward.
QFL Strategy Reference:
"QFL" (Quick Fingers Luc strategy) is marked with a red line, identifying a key support zone that price may break below.
50% level (retracement or zone midpoint) is noted for confluence.
Target Zone:
Final target appears to be in the $112,500 – $113,000 range.
Summary:
The chart presents a bearish thesis expecting BTC to break the ascending channel and fall toward a previous demand zone marked by the QFL level. The structure supports a short setup if the lower trendline fails to hold.
Risk Note: This is a speculative forecast; always confirm with volume, broader market context, or confirmation patterns.
thank u
#BinanceHODLerC #AltcoinBreakout #ETHBreakout3.5k #BinanceHODLerERA #PowellVsTrump
