Understand the MACD indicator in one article! A must-watch for beginners 🌟
📌 Composition of MACD indicator
DIF fast line: The difference between the 12-day exponential average and the 26-day exponential average.
DEA slow line: The 9-day moving average of DIF.
MACD red and green bar line: Reflects the change in strength between bulls and bears. Red bars turning into green bars indicate bearish dominance; green bars turning into red bars indicate bullish dominance.
0 axis: The dividing line of long and short forces, above the 0 axis is dominated by bulls, below the 0 axis is dominated by bears.
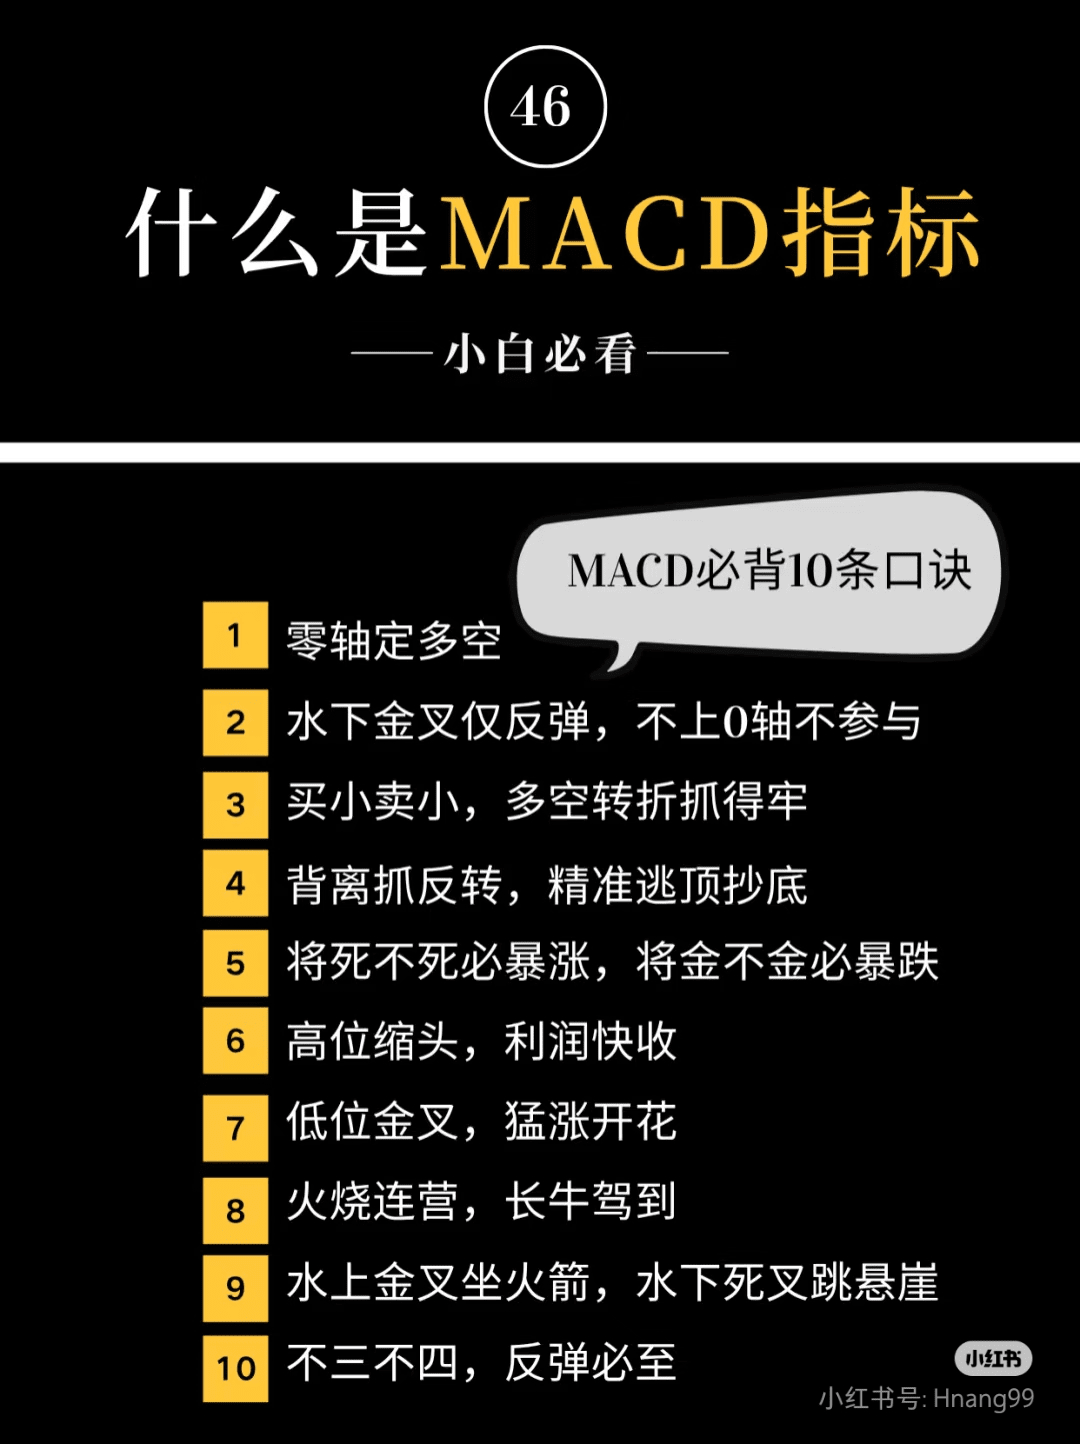
🌟 10 golden rules of MACD must be memorized!
1️⃣ Zero axis determines long and short
Both lines above the 0 axis → Bullish market 📈 (Hold stocks and wait for rise)
Both lines break below the 0 axis → Bear market 📉 (Run for your life)
The 0 axis is the boundary between bull and bear markets, easily lock in long and short positions!
2️⃣ Golden cross underwater only rebounds, do not participate until it reaches 0 axis
Golden cross below the axis = rebound during decline, mostly a trap!
Wait for both lines to stabilize above the 0 axis before taking action to avoid bottom fishing turning into picking up the pieces
3️⃣ Buy small, sell small, firmly grasp the turning points of long and short
Buy small: Stock price drops, the next wave after the green bar is shorter than the previous wave → Bearish force exhausted, bottoming signal
Sell small: Stock price rises, the next wave after the red bar is shorter than the previous wave → Bullish fatigue, peak escaping signal
Rule: “Big before, small after, golden cross must be done; high before, low after, volume must run”
4️⃣ Capture reversals with divergence, accurately escape peaks and bottom out
Top divergence: Stock price hits a new high🔥, but MACD declines → Hurry to escape the peak!
Bottom divergence: Stock price hits a new low💧, but MACD rises → Prepare to bottom out!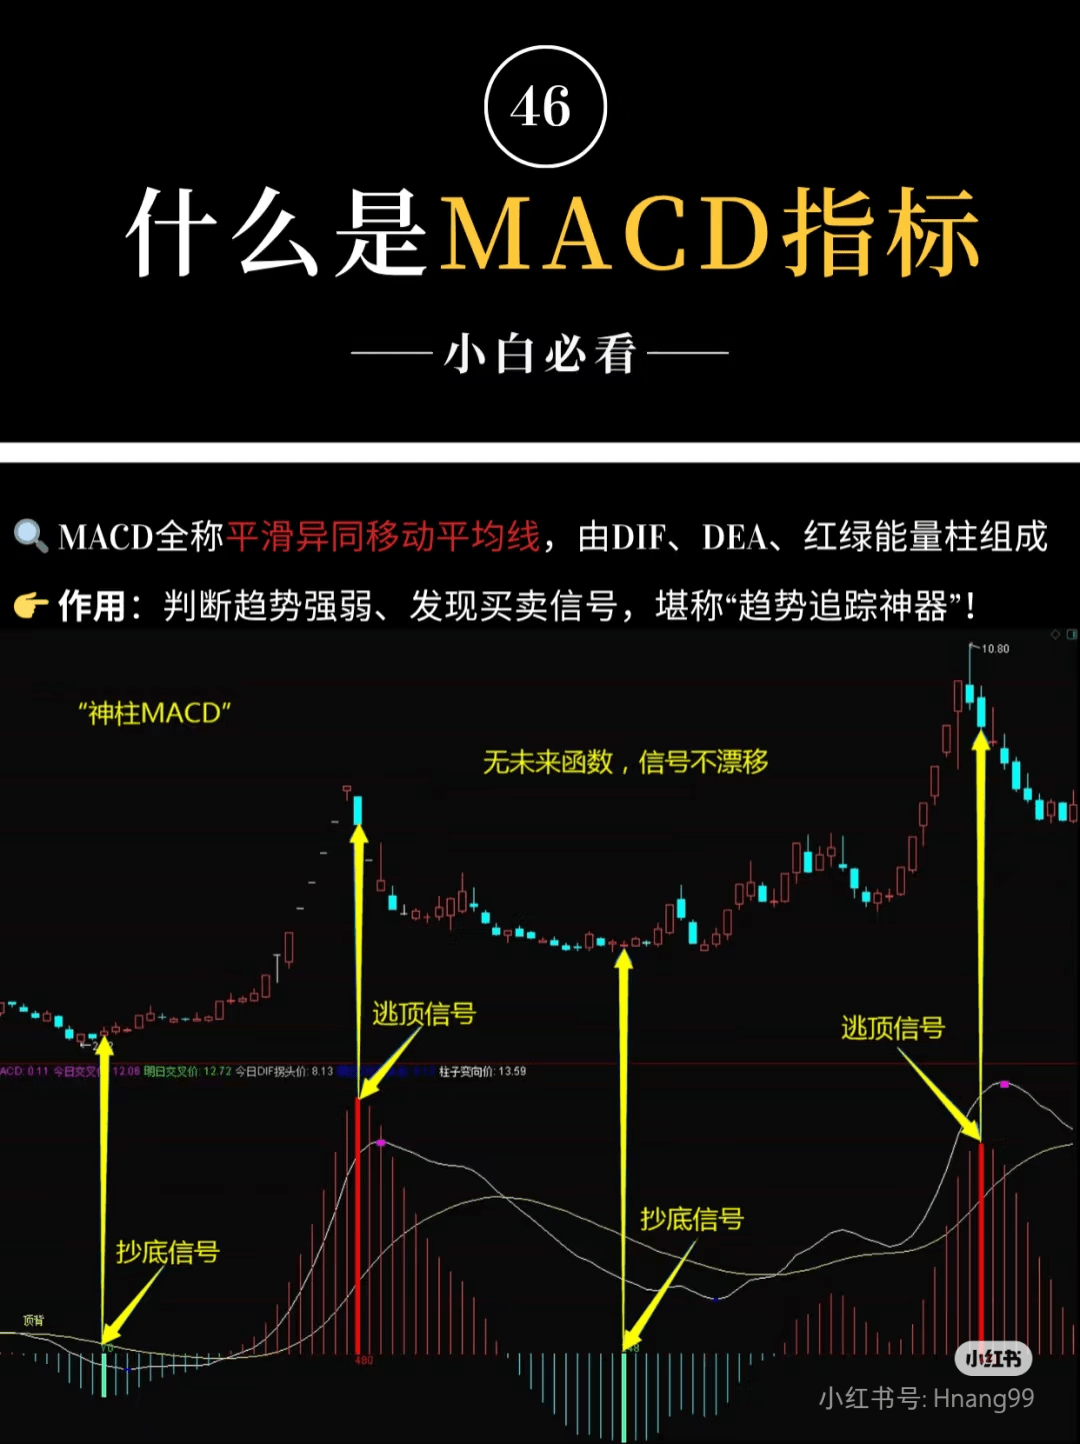
Top divergence accuracy > Bottom divergence, especially reliable on weekly levels
5️⃣ Neither dead nor alive must soar, neither gold nor not must plummet
Red bar shortens then suddenly elongates (neither dead nor alive) → Main force washing out finished, main rising wave starts 🚀
Green bar shortens then suddenly elongates (is it gold or not) → Continuation of decline, quickly cut losses
6️⃣ High position contraction, quickly take profits
Stock price skyrockets + red bar suddenly shortens + far from 0 axis → Main force dumping, take profit without hesitation!
7️⃣ Golden cross at a low position, skyrocketing blooms
Stock price plummets + golden cross far from 0 axis → Rebound is guaranteed, if a second golden cross appears, the strength doubles 💥
8️⃣ Fires burn continuously, a long bull market is coming
Red bar continues for >2 months → Sign of a big bull stock 🐮, hold steady and don't get off!
9️⃣ Golden cross above water rides a rocket, death cross below water jumps off a cliff
Golden cross above the 0 axis → Main rising wave begins 🚀
Death cross below the 0 axis → Warning of a sharp decline ⚠️
🔟 Neither here nor there, a rebound is imminent
After breaking below the 0 axis, the 3rd or 4th wave → A rebound is guaranteed! Combine with wave theory to seize short-term opportunities 🌊
#MACD #TechnicalAnalysisIntroduction #BeginnerFinance #TechnicalAnalysis #StockTradingEssentials #StockTradingIntroduction
The rules need to be applied flexibly, the market has risks, and investment requires caution~