#### Overall Trend
On the four-hour chart, Bitcoin shows a slightly bullish trend during the last session. After a period of fluctuation between $117,000 and $119,000, the price has started to slowly but steadily test higher levels.
#### Key Levels: Support and Resistance
- First Support Level: $118,500
This level represents an important demand area where the price has returned multiple times without a clear break, and it can be a suitable entry point for short-term investors.
- Second Support Level: $117,500
This is the minimum that has maintained market stability so far, and it serves as the main line of defense against any potential downturn.
- First Resistance Level: $120,000
This is an important psychological level that was recently breached, and if the price remains above it, it may open the way towards levels of $121,500.
- Second Resistance Level: $121,500
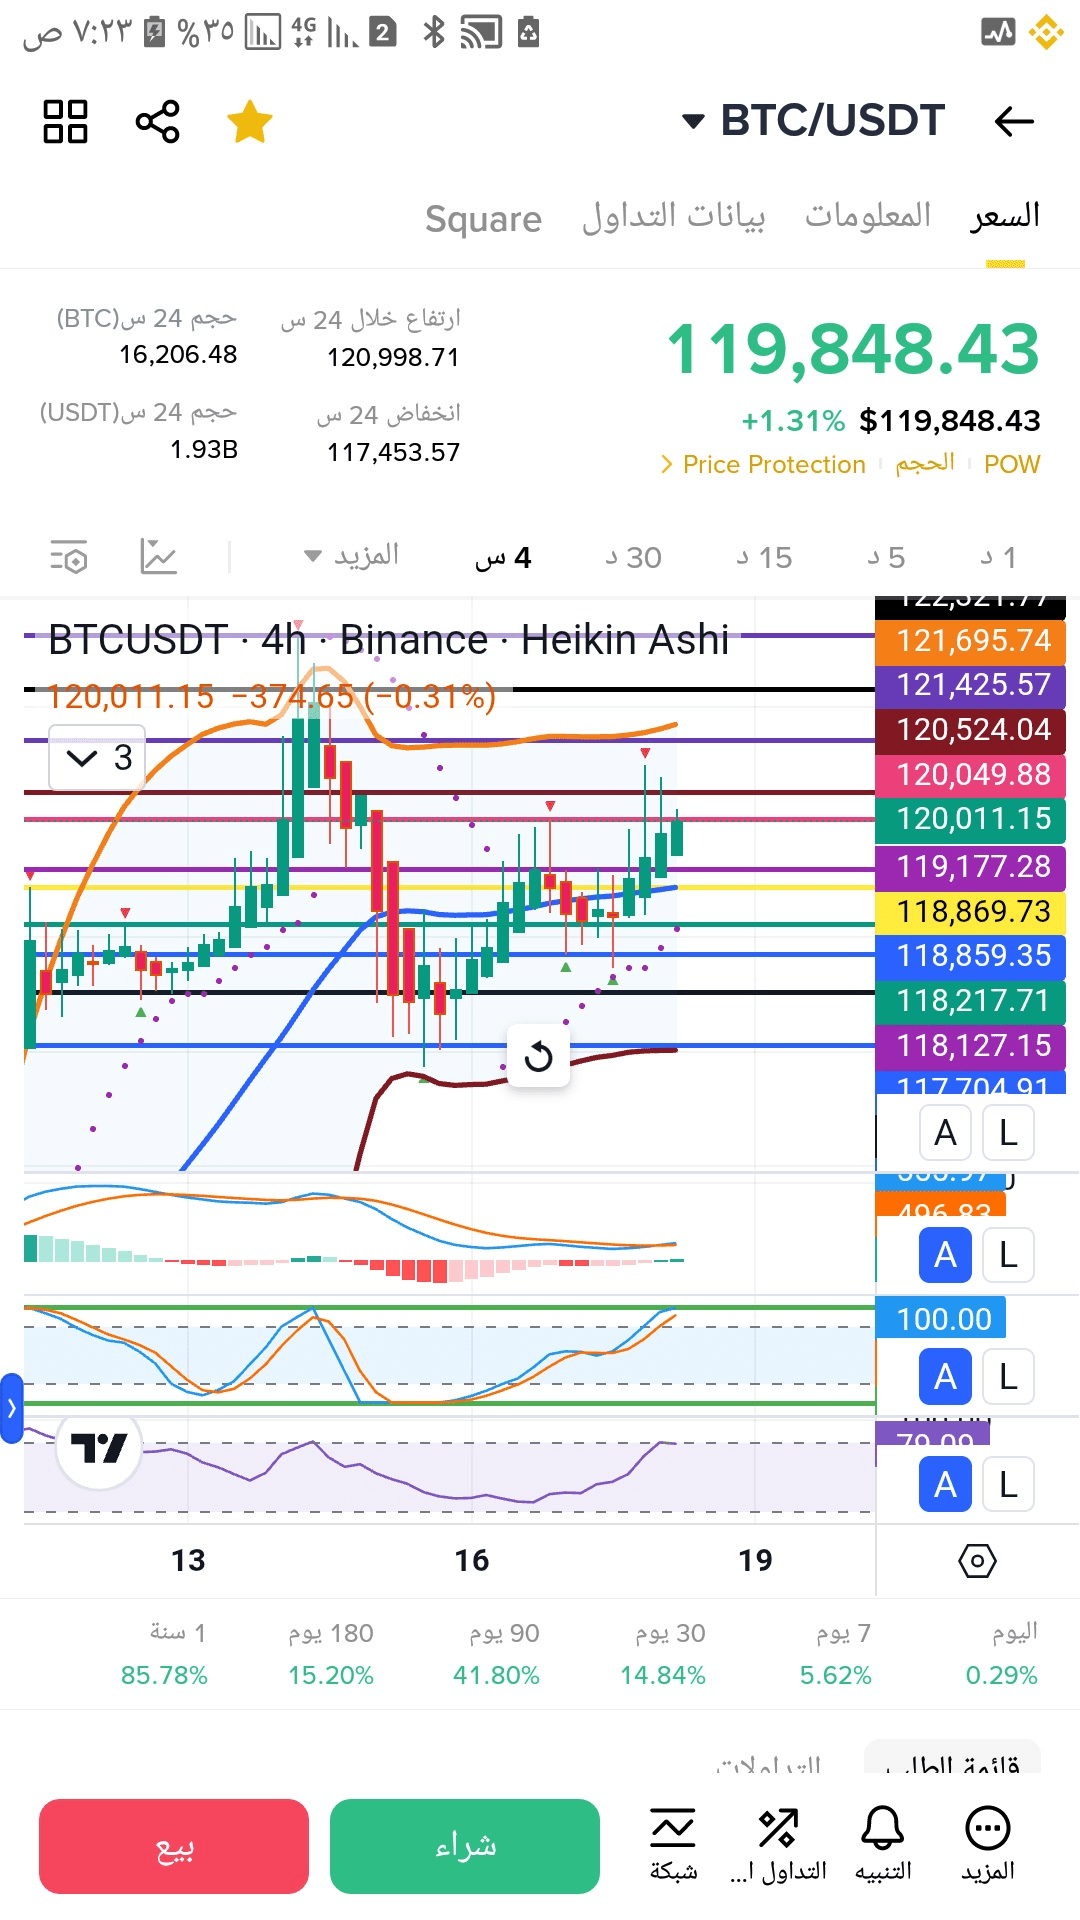
If the bullish momentum continues, buyers may target this level as a primary objective in the upcoming sessions.
- Current Trend: Slightly Bullish
- Expected Scenario: If BTC maintains a level of $118,500 or higher, it is likely to target $120,000 - $121,500.
- Important Note: Pay attention to any sharp reversal or daily close below $117,500, as it may indicate a larger correction.
😎👍❤

