 Ethereum (ETH) is currently demonstrating robust bullish momentum in July 2025, underpinned by significant institutional interest, substantial spot Exchange-Traded Fund (ETF) inflows, and continuous advancements within its underlying network. Technical indicators predominantly signal a strong uptrend, although some metrics suggest the asset is entering overbought territory, necessitating careful monitoring.
The anticipated approval of ETH staking ETFs stands as a potentially transformative catalyst, poised to re-position Ethereum as a high-yield institutional-grade asset. Concurrently, Ethereum's deflationary tokenomics, a result of the EIP-1559 implementation and its transition to Proof-of-Stake, coupled with its expanding utility as the foundational layer for Decentralized Finance (DeFi), Layer 2 (L2) solutions, and Real-World Assets (RWAs), continue to reinforce its fundamental value proposition. While short-term consolidation may occur following rapid recent gains, the mid-to-long-term outlook for Ethereum remains highly optimistic, with expert projections ranging from $10,000 to an ambitious $1.5 million, contingent upon sustained adoption and the emergence of clearer regulatory frameworks.
Current Market Overview
Latest Price and Performance
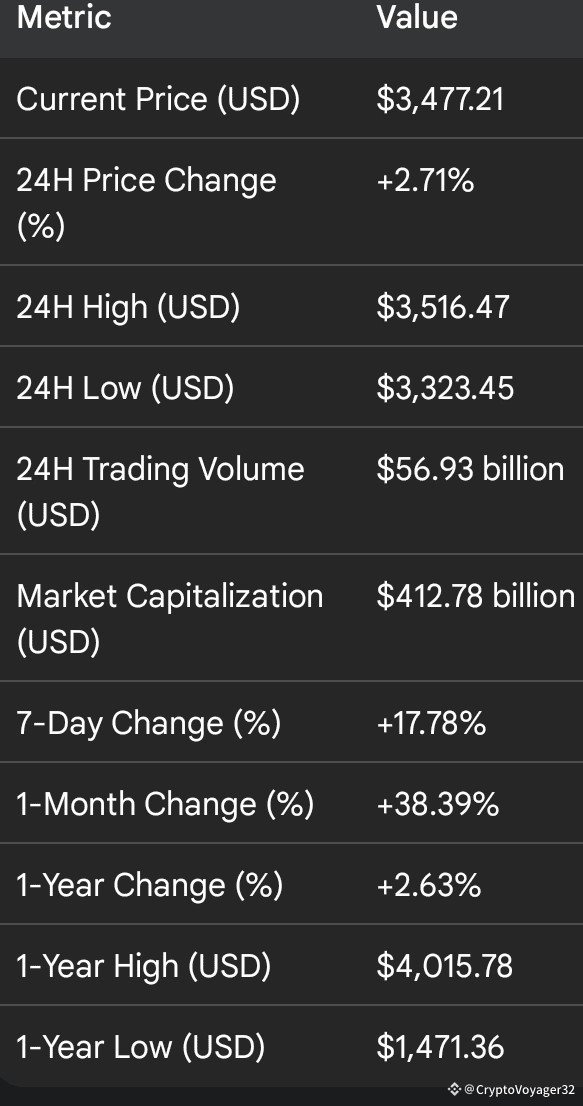
As of July 17, 2025, Ethereum is trading around $3,477.21. Other market data providers report slightly varying prices, such as $3,441.37 or $3,425.09 , which reflects the dynamic nature of real-time market data in the highly volatile cryptocurrency market. The 24-hour performance shows a +2.71% increase , though some sources indicate higher daily gains of +8.41%. This variation in reported 24-hour price changes across different sources, even for roughly the same date, underscores the extreme volatility and rapid price fluctuations inherent in the cryptocurrency market. It highlights that even minor differences in data capture times can lead to significantly different reported short-term performance figures, emphasizing the need for real-time data and continuous monitoring for active participants. The 24-hour high for ETH was $3,516.47, and the low was $3,323.45.
Trading Volume and Market Capitalization
Ethereum's current 24-hour trading volume is approximately $56.93 billion , although another source notes $49.27 billion , indicating robust liquidity across exchanges. The market capitalization of Ethereum stands around $412.78 billion , consistently hovering between $400 billion and $417 billion across various data providers.
Historical Performance Trends
ETH has demonstrated strong recent gains, with a +17.78% increase over the past 7 days and an impressive +38.39% over the past month. Over the past three months, Ethereum's price has surged by almost 90%, significantly outperforming Bitcoin and Solana during this period. This strong recent momentum contrasts with its more modest 1-year performance of +2.63% , and a slight decrease of -2.28% from one year ago as of July 17, 2025. This indicates a recent sharp reversal from a period of prior underperformance. The asset had been lagging behind key rivals like Bitcoin and Solana, but this is no longer the case. The impressive gains over the past week and month, following a period of relatively flat or even negative year-over-year performance, suggest that ETH has only recently begun to outperform. This recent surge could signify a renewed investor interest and a potential rotation of capital into Ethereum, anticipating further upside as it closes the performance gap with other major cryptocurrencies. The highest price of ETH in the last year was $4,015.78, and the lowest was $1,471.36.
Key Ethereum Market Statistics (Current)
Overall Technical Outlook
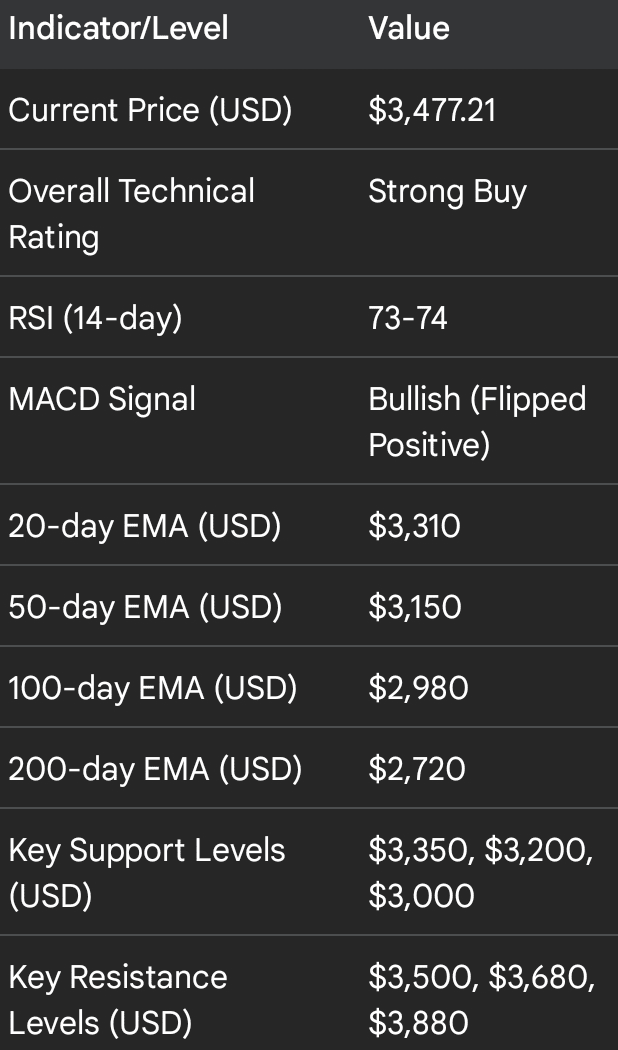
The aggregated technical ratings for Ethereum present a compelling "strong buy" signal across multiple timeframes, including the current day, 1-week, and 1-month outlooks. This robust rating is derived from a combination of popular technical indicators, suggesting a prevailing bullish sentiment that has been consistent.
Moving Averages (MAs)
Ethereum is currently trading comfortably above all key Exponential Moving Averages (EMAs) and Simple Moving Averages (SMAs), specifically the 20-day ($3,310), 50-day ($3,150), 100-day ($2,980), and 200-day ($2,720). This alignment of price above all major moving averages is a strong technical confirmation that buyers remain in charge and the underlying uptrend is intact. A significant bullish development occurred as ETH recently broke through its 200-day SMA, a critical long-term resistance level it had been testing since early May. It had previously crossed the 100-day line in May. The overall rating for Moving Averages is unequivocally a "strong buy".
Momentum Indicators (RSI, MACD)
The Relative Strength Index (RSI) is currently high, reported at 73 and 74 , indicating that Ethereum is in "overbought" territory. Typically, an RSI above 70 signals that an asset is overbought and potentially due for a correction. However, analysts note that it is "not yet diverging," suggesting that the rally still has legs and strong buying pressure persists. This indicates that the current buying pressure, likely fueled by strong fundamental catalysts such as ETF inflows, is exceptionally robust, overriding conventional technical sell signals. This suggests a powerful, fundamentally-driven rally that may sustain its upward trajectory despite being technically extended, implying that traditional technical analysis might need to be interpreted with a deeper understanding of underlying market drivers.
The Moving Average Convergence Divergence (MACD) flipped positive at the very end of June and continues to signal bullish momentum, supported by increasing volumes. A significant bullish signal, the "golden cross" (where a shorter-term moving average crosses above a longer-term moving average), also occurred for Ethereum at the very end of June around the same time the MACD flipped positive , further reinforcing the positive trend.
Key Support and Resistance Levels
Ethereum is currently approaching key resistance levels. The next technical hurdles are identified around $3,500, $3,680, and $3,880. TradingView lists specific resistance at $3,506.17 (R1), $3,519.55 (R2), with a final target of $3,650.71. A clean breakout above $3,300 could open doors to $3,500–$3,750.
On the downside, initial support levels are identified at $3,350, $3,200, and $3,000. A broader rising trendline near $2,500 and $2,770 is also noted as a key support area. The pivot point is $2,821.91, with first support at $2,649.43.
A notable observation is that Ethereum appears to be in an earlier stage of its bull cycle compared to Bitcoin. Ethereum's MACD crossover occurred below the zero line, whereas Bitcoin's crossover happened earlier and closer to the zero line. This suggests that ETH had more negative sentiment and price action to overcome, implying that it is now in a nascent phase of a significant upward trajectory with potentially more untapped upside compared to Bitcoin, which has already experienced substantial gains and is currently consolidating. This view is further supported by the Ethereum Volatility Index (EVIV) gaining on Bitcoin's, reaching its highest level against Bitcoin since 2022. This indicates increasing investor focus and expected price movements for ETH, potentially signaling a capital rotation into Ethereum.
Ethereum Technical Indicators & Key Level