The long strategy for Bitcoin/Ethereum given last night has seen Bitcoin/Ethereum prices touch 120951/3524 during the early hours today, with Bitcoin gaining over two thousand points and Ethereum gaining over a hundred points.
 $ETH
$ETH
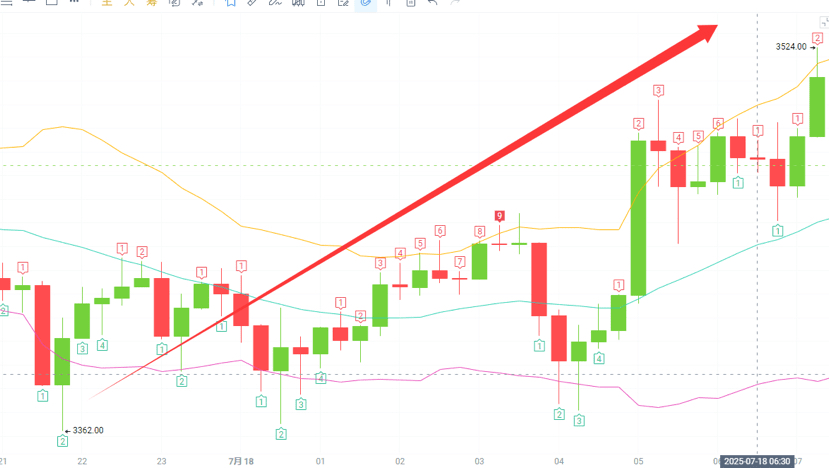
From the current market perspective, the daily chart shows a continuous rise over several days, forming a clear upward trend. The closing price on July 17 broke through the previous high of 3524 but then pulled back, and the current price is in an adjustment phase. Recently, the hourly chart has shown a long upper shadow, indicating strong selling pressure above, while the price is oscillating around 3480 in the short term. The MACD on the hourly chart shows that the DIF is below the DEA, and the MACD histogram is negative, indicating weakened momentum, but overall it is still above the zero line, suggesting a bullish trend. The RSI value is 68.09, close to the overbought range, so caution is needed for short-term pullback risks; the daily RSI remains above 60, supporting a bullish outlook in the medium to long term. EMA7 > EMA30 > EMA120, the moving averages show a bullish arrangement, supporting the short-term upward trend; the daily EMA also maintains a bullish arrangement, further confirming the upward trend in the medium to long term. #以太坊连续两日领涨 $BTC
Bitcoin: Long 119000-118500, target around 122000
Long Ethereum 3450-3400, target focus on 3550-3580