BNB is standing out as it holds steady inside a rising channel on the weekly chart. Prominent analyst Crypto Patel pointed out that Binance Coin price is staying strong above a key support level and showing signs of building momentum.
He added that if the price breaks out of its current range with volume, things could move quickly toward the next big target.
The setup looks like a classic mid-to-long-term uptrend. BNB has been making higher highs and higher lows, staying within this upward channel that’s been in play since mid-2023.
Right now, it’s consolidating near the upper half of that range, and traders are keeping a close eye on whether it can break through resistance in the weeks or months ahead.
Read Also: Analyst Says Owning 2,000 Ripple (XRP) Tokens Can Be Life-Changing: Here’s How
BNB Price Ascending Channel Maintains Bullish Structure
The weekly chart displays a clearly defined ascending channel, which has been guiding BNB’s trend for over a year. Price action remains well-supported by the lower boundary of the channel, which has served as a reliable foundation for prior rallies.
BNB price is now positioned in the upper half of this channel, with momentum gradually building toward the top of the range.
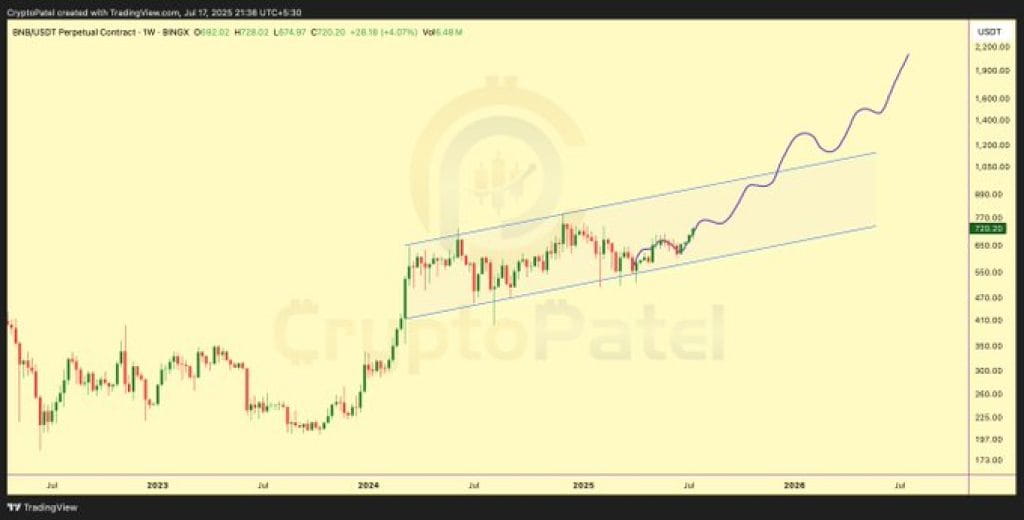 Image Source: X/CryptoPatel
The lower boundary held firm during previous corrections, while the midline of the channel acted as dynamic support. Price is now trading above that midline, suggesting that bulls are maintaining control over the current structure. The asset’s recent higher highs signal the continuation of a broader upward trend.
Read Also: Here’s Why FLOKI Price Is Pumping
BNB Price Key Support Holding Around Historical Levels
BNB has shown strong reaction at the $560 support zone. This level has been tested multiple times and continues to act as a base for the current price movement. CryptoPatel noted that the market is holding firm above this area, which further supports the ongoing bullish structure.
Support from this level, combined with the long-term channel, suggests that BNB price has remained in accumulation or early expansion phases since the start of the year. The price has shown strength in defending this zone, allowing for a gradual build-up toward potential breakout levels.
Moreover, the upper part of the channel is located near the $800–$850 range. While not labeled directly on the chart, this area may serve as a near-term resistance. If BNB price moves above that zone with volume, the structure points toward an extended run targeting the next major liquidity region.
The projected path shows a stair-step move higher, with corrections followed by continuation. Based on the analyst’s tweet, the target aligns with a psychological level that previously acted as a major top. This suggests that if momentum sustains, the breakout could bring BNB toward historical levels that once saw heavy interest.
Read Also: Is Pi Coin Really a Scam? Here’s What One Top Analyst Thinks
BNB Price Trend Outlook Aligns With Momentum Build
The channel structure reflects a steady, controlled trend. While volume indicators are not visible on the chart, the consistent candle structure and positioning within the trendline suggest increasing momentum. BNB price continues to respect its broader range while preparing for a potential breakout.
As long as support levels remain intact and buyers continue to defend key zones, the price may be preparing to enter a higher trading range. Traders are now watching whether the asset can challenge upper resistance with volume, which would reinforce the current trend and confirm a shift into the next phase of expansion.
Subscribe to our YouTube channel for daily crypto updates, market insights, and expert analysis.
The post BNB Price Coils Above Support With One Target in Sight: Here’s What the Chart Reveals appeared first on CaptainAltcoin.


