Ripple (XRP) is only 2% away from new highs — but which new high should be referred to?
Ripple Market is Booming — But which new high does it need to break?
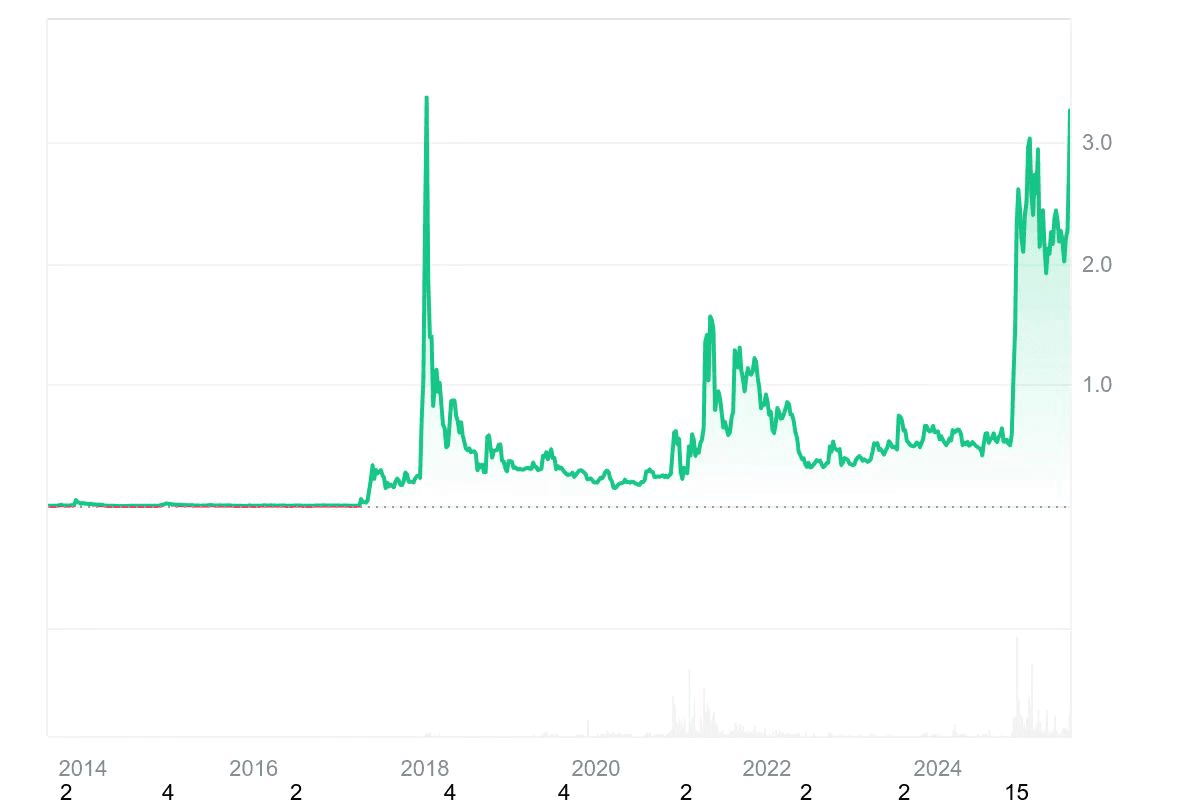
In the past 24 hours, Ripple has experienced explosive growth, breaking through key resistance levels and entering a price range not seen in years. However, there is confusion in the market: some platforms show Ripple is only 2% away from its all-time high (ATH), while others claim it is still nearly 15% away.
So, which one is correct?
Two all-time highs: CoinMarketCap vs TradingView
1. CoinMarketCap (CMC)
All-time high: 3.84 USD
Date: January 4, 2018
This all-time high reflects aggregated data from global exchanges, including established platforms like Bitstamp and Kraken.
2. TradingView (Binance data)
All-time high: Approximately 3.39 USD
Date: January 2025
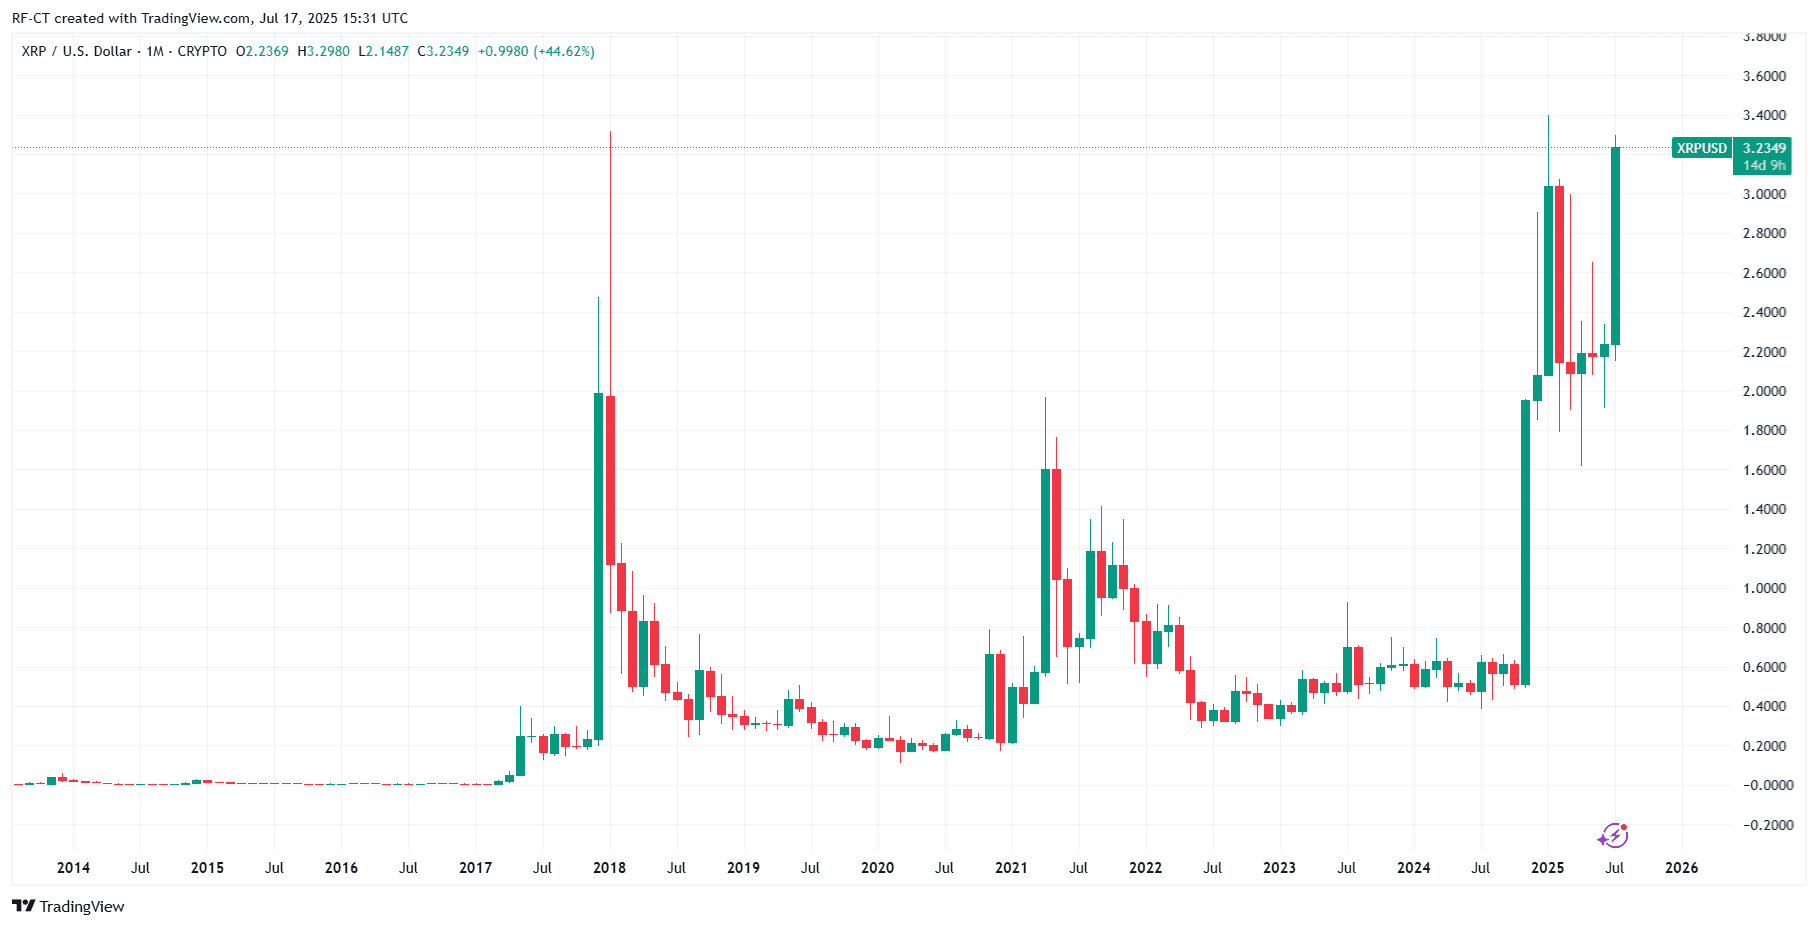
The XRP/USDT trading pair on Binance did not exist in 2018, so it only reflects newer highs within this cycle.
Conclusion:
CoinMarketCap's all-time high is the true historic maximum, widely recognized in the industry. However, on charts from specific exchanges like Binance, Ripple is actually in a price exploration phase — just 2% away from new highs on that platform.
Ripple Price Analysis: Resistance and Support Levels
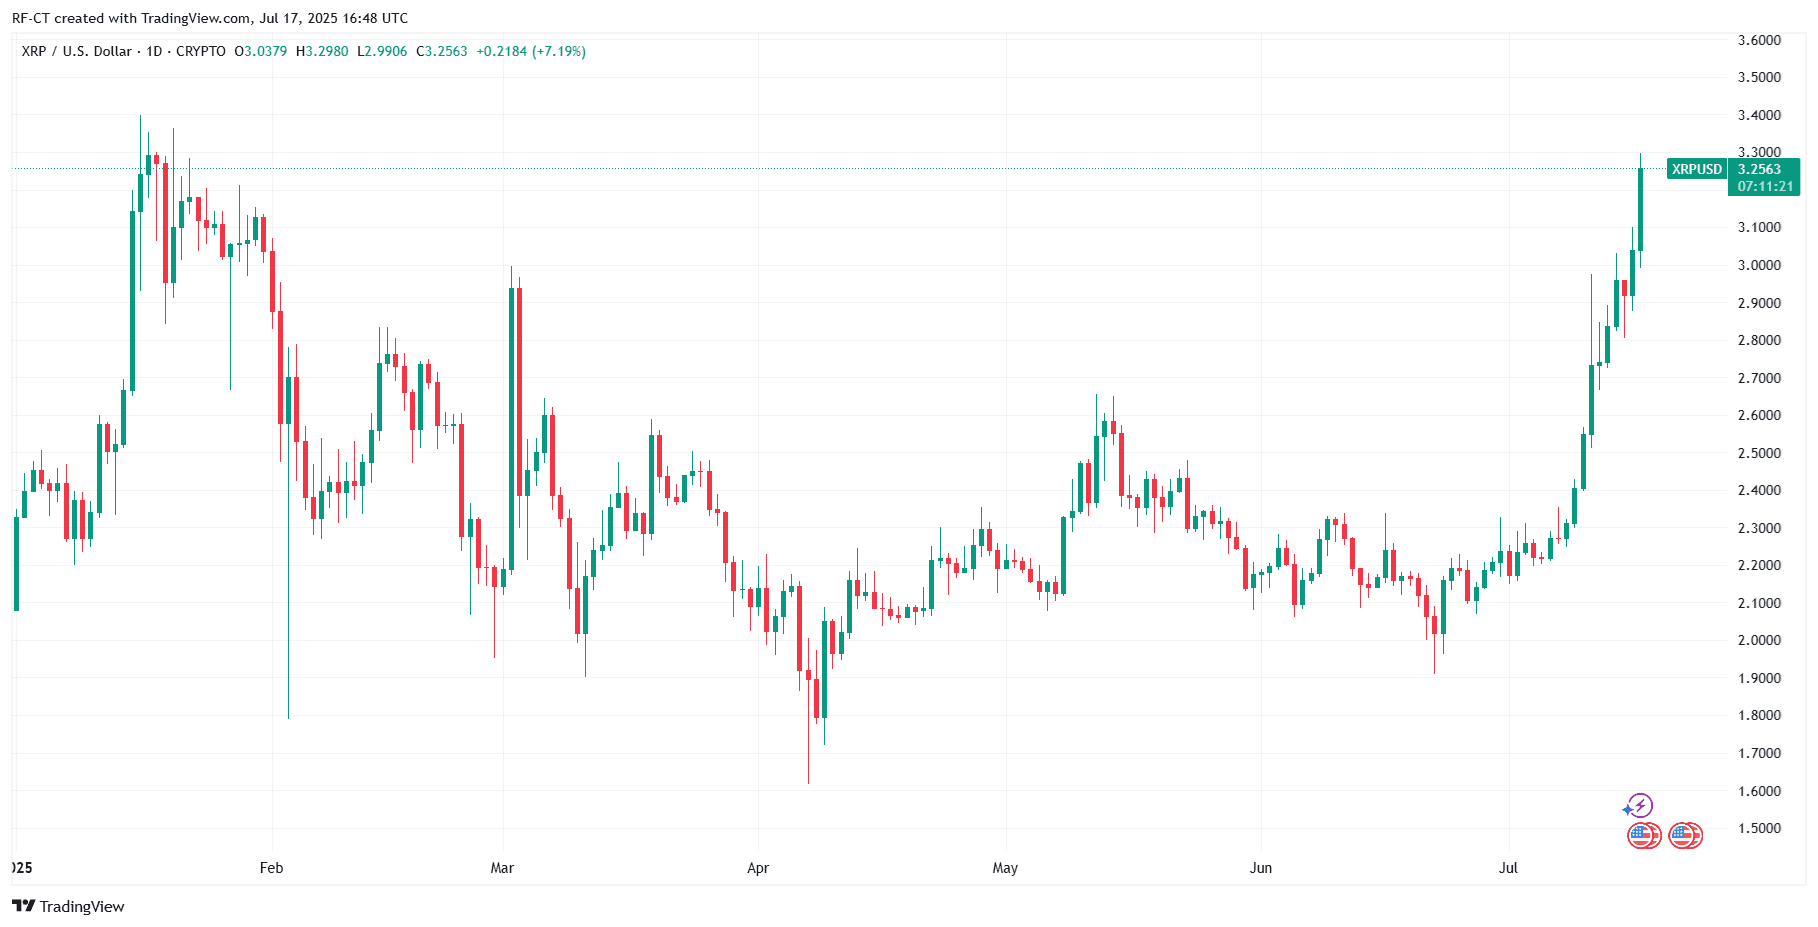
As of the time of writing, Ripple's trading price is slightly below 3.33 USD, with bullish momentum clearly maintaining integrity. Let's take a look at the chart structure:
Recent resistance levels:
- 3.39 USD — Local historical high on Binance. Breaking this level will... open the door
- 3.60–3.84 USD — Macro resistance range (historical high from CoinMarketCap and psychological level)
- 4.20–4.50 USD — Extension target based on Fibonacci projection (from 0.45 USD to 3.39 USD increase at the 1.618 level)
Support levels:
- 3.20 USD — Recent breakout level
- 2.95 USD — Major consolidation range
- 2.40 USD — Strong historical support from the previous cycle's top structure
Volume is rising, the relative strength index (RSI) on the daily chart has not yet been overbought, and the average candlestick (Heikin Ashi) shows a strong upward trend continuation.
Ripple Price Prediction: What’s next?
If Ripple can close above 3.40 USD on the daily chart, we might see:
Moving towards the global all-time high of 3.84 USD
If 3.84 USD is broken with volume, the next target will be:
- 4.20 USD — First major Fibonacci extension level
- 5.00 USD — Psychological milestone
- 5.40–5.60 USD — Extending wave structure top (depending on whether the volume can sustain)
However, if it fails to break through and stay above 3.40 USD, a short-term pullback may occur, retesting the support level of 3.00–3.20 USD.
Should I buy Ripple (XRP) now?
This article does not constitute financial advice, but Ripple is showing strong bullish continuation signals, and many traders are closely watching whether it can confirm a breakout to new highs.
Ripple is about to break its local historical high, just less than 2% away from new highs on major exchanges like Binance. Although there is still a 14–15% gap to the true all-time high of 3.84 USD (from CoinMarketCap), the current momentum is clearly enough to push it towards that level, and it may even surpass it.
With a bullish technical outlook, rising volume, and a warming up of the entire altcoin market, Ripple may be preparing for its most significant breakout in nearly a decade.
$XRP $BNB $SOL #山寨季何时到来? #Strategy增持比特币 #BTC再创新高 #迷因币情绪 #以太坊连续两日领涨


