
📈 Structure Breakout Detected
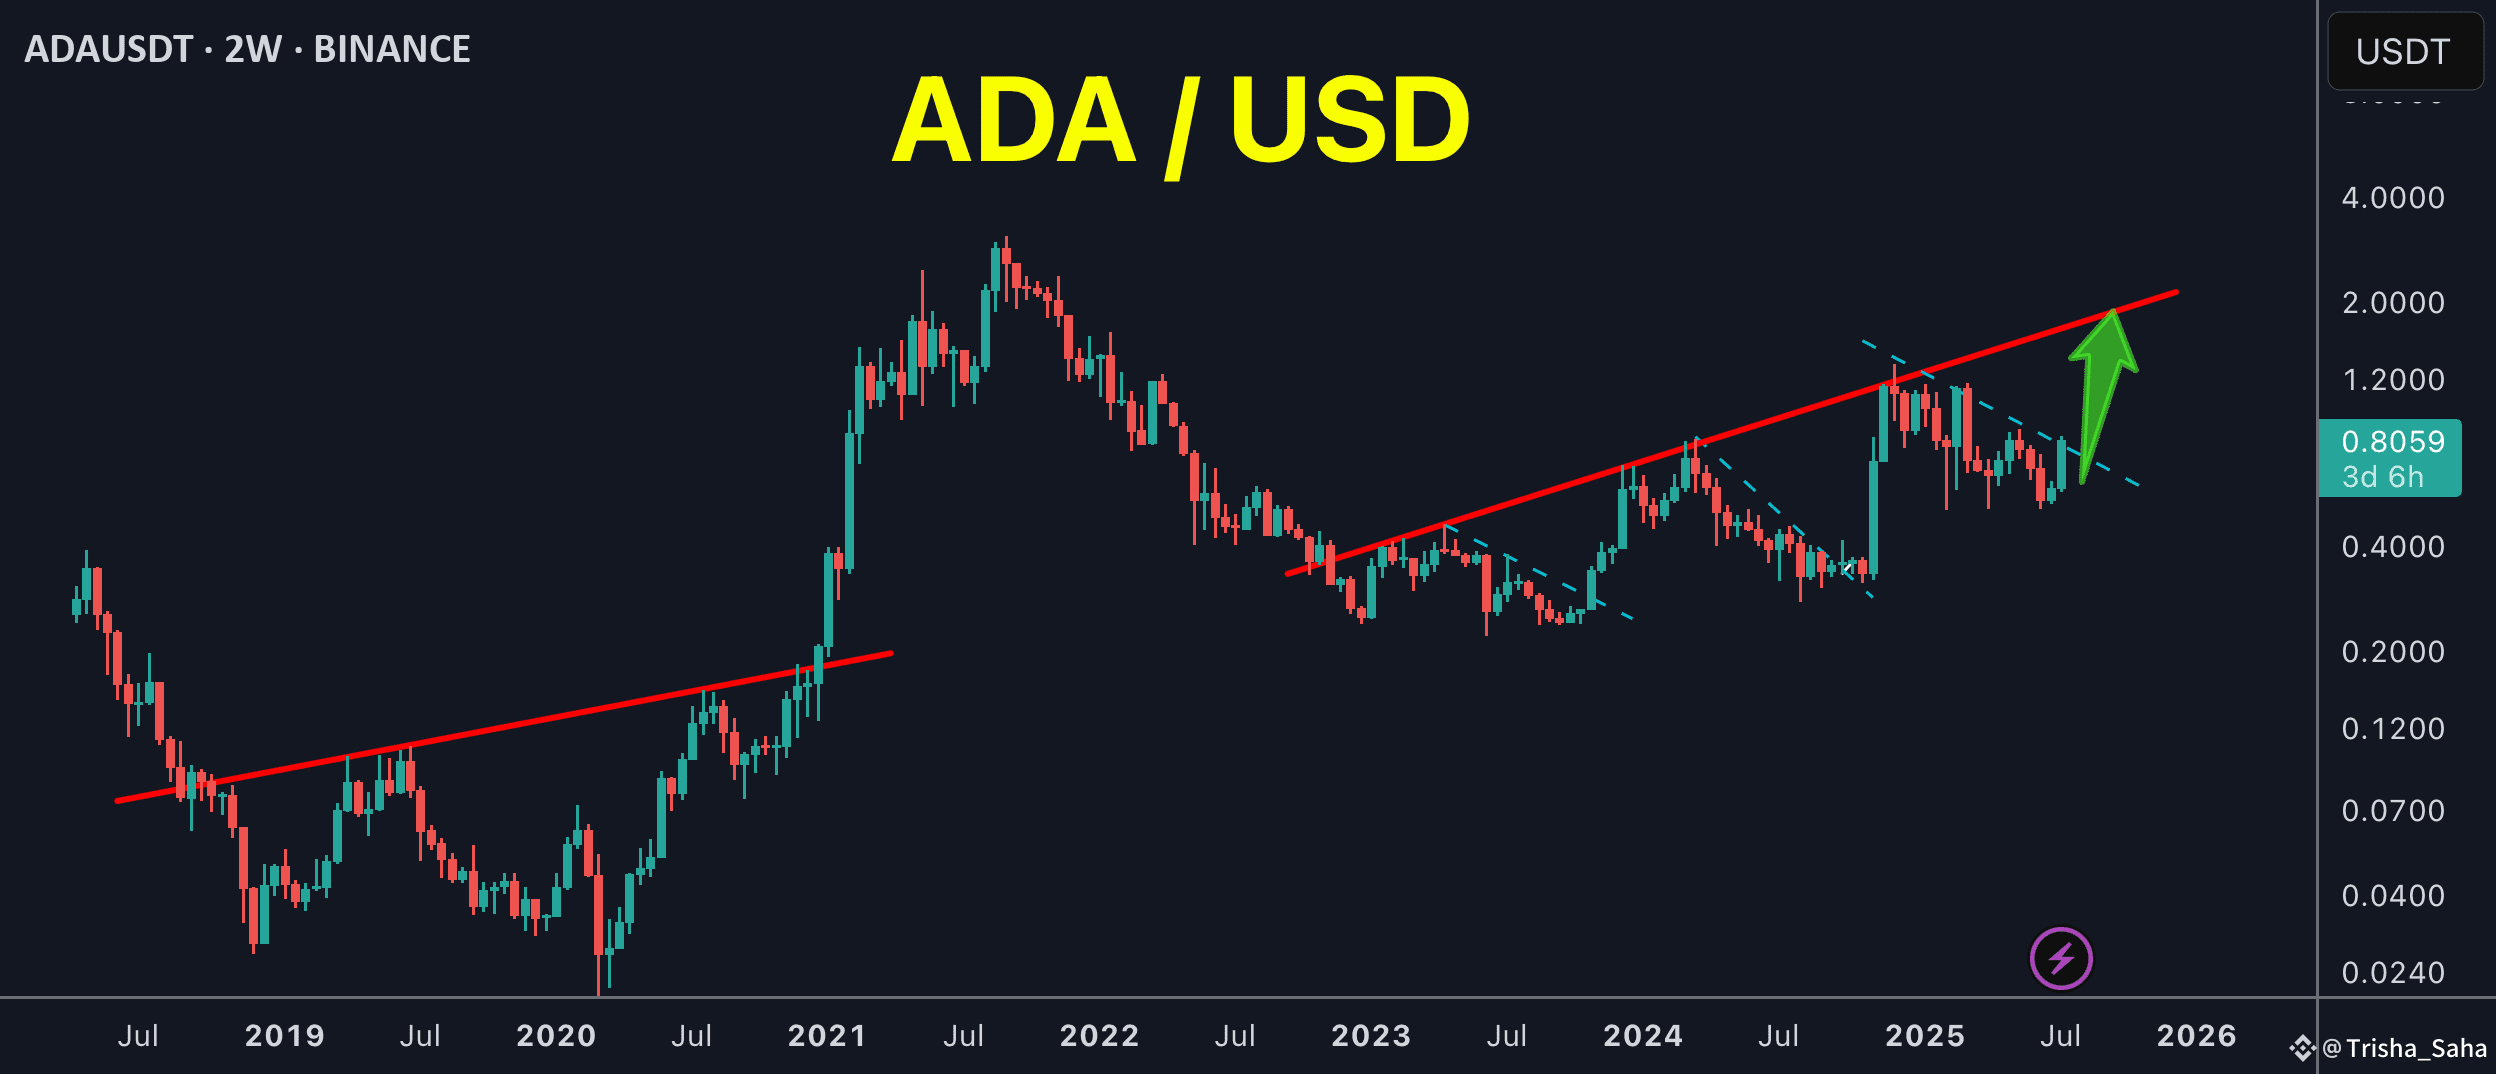
ADA recently broke out from a falling wedge structure (blue dashed lines), which is often a bullish reversal pattern.
The breakout has occurred above $0.80, with potential continuation toward long-term resistance near $1.40–$2.00.
📊 Key Observations:
✅ Historical Trendline retested successfully — now acting as support.
🔺 Bullish momentum gaining strength after multiple rejections near the wedge resistance.
🕒 Long-term consolidation phase may be ending, entering potential accumulation to markup phase.
📌 Price Zones to Watch
Key Zone Price Remarks
Entry Range $0.76 – $0.82 Post-breakout retest zone
Mid Target (TP1) $1.10 Historical supply zone
Major Target (TP2) $1.40 – $2.00 Long-term resistance
SL Suggestion Below $0.66 Invalidates breakout
🧠 Why Bullish?
Structure breakout + retest on a macro trendline
Historical pattern similarity with the 2020–2021 bullish breakout
Strong support build-up around $0.70
Weekly candle closing above $0.80 is encouraging
🧘♀️ Pro Tip for Spot Traders:
As Spot traders, we focus on capital protection first.
ADA is showing a potential high R:R long-term setup, but no need to FOMO.
Always scale in during pullbacks, and be patient with targets — especially on a 2-week
