ETH Crash Money-Making Guide: Seize Correction Opportunities, Insight into Market Signals
In the cryptocurrency market full of opportunities and challenges, ETH (Ethereum) has always been a focal point of attention. Recently, ETH has experienced extreme price fluctuations, with crashes and rebounds occurring alternately. How can one accurately 'pick up money' in such a turbulent market? This article will provide a practical guide for making money during ETH's crash based on technical analysis charts.
1. Recent Review of ETH Market
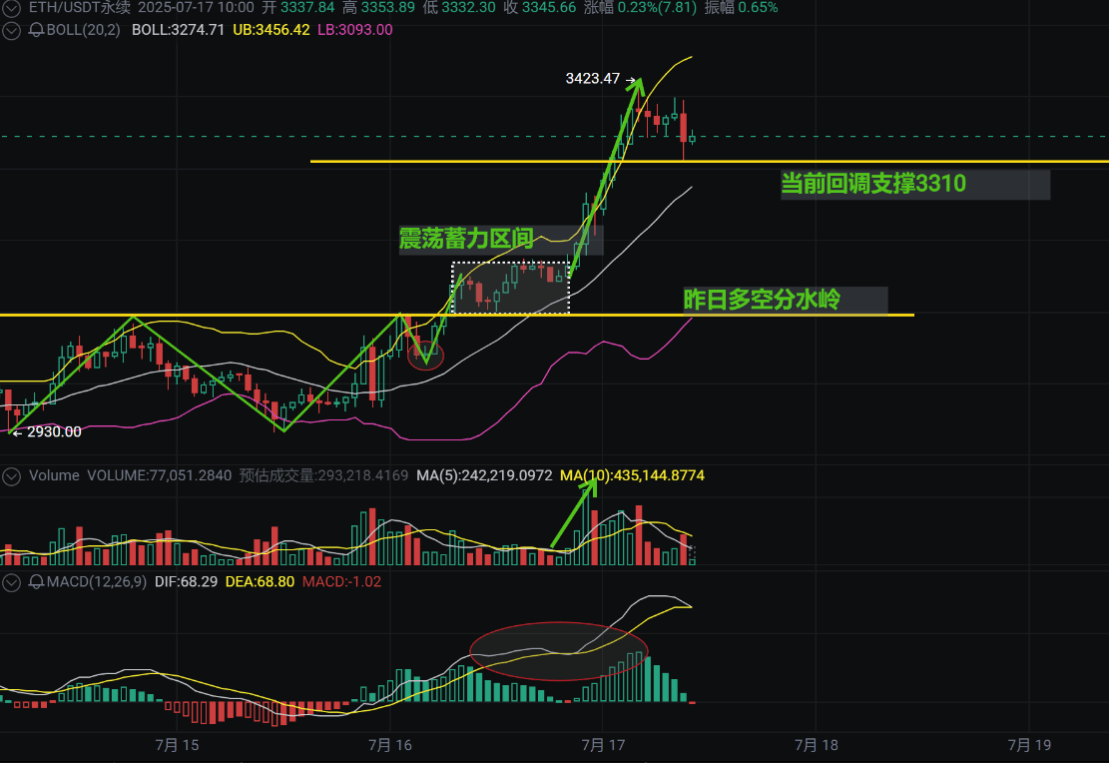
From the chart, it is clear that ETH has recently experienced a significant upward trend, with the price rising from relatively low levels to a high of 3423.47. During this process, market sentiment was high, and investors flocked in. However, ETH's price subsequently experienced a correction, which undoubtedly provided an opportunity for those investors trying to buy at lower levels.
2. Analysis of Key Support and Resistance Levels
(1) Current support for the correction is at 3310
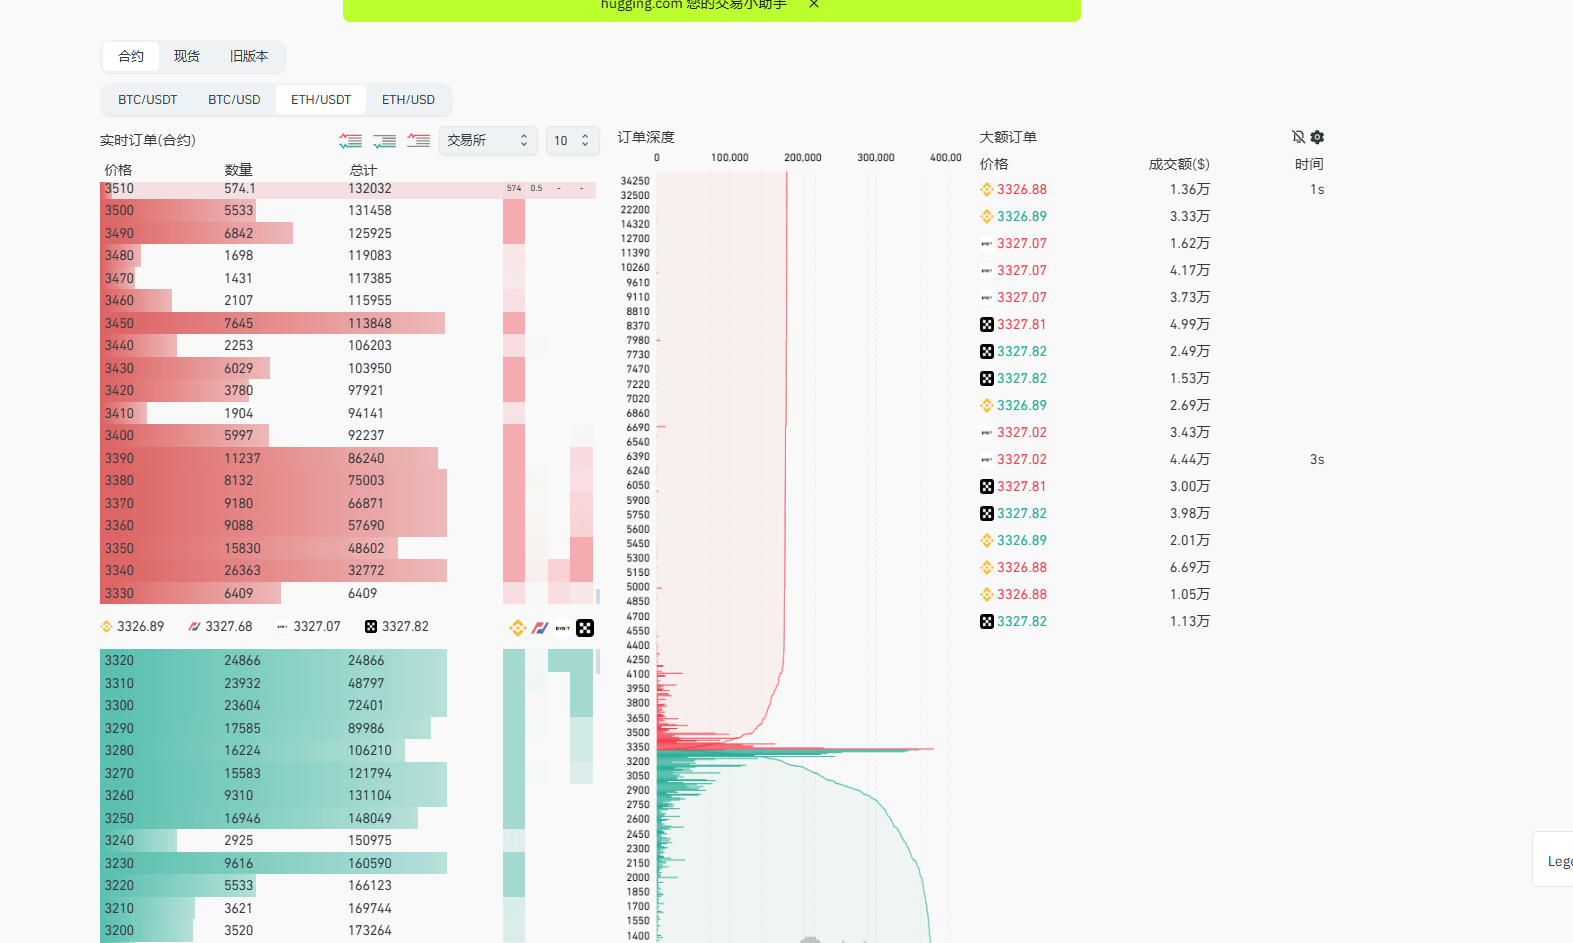
3310 is currently an important support level during ETH's price correction process. From a technical analysis perspective, this level has previously provided effective support for ETH’s price multiple times, indicating that there is a certain buying power present. When the price approaches this level again, investors need to closely monitor whether it can hold. If it can successfully hold, it may indicate that the price will stabilize here and initiate a new round of upward movement; conversely, if the price effectively breaks below this support level, it may signify that the downtrend will continue, and investors need to adjust their strategies promptly to avoid further losses.
(2) Yesterday's Bull-Bear Dividing Line
Yesterday's bull-bear dividing line played an important role in ETH's price movement. It reflects the shift in market forces between bulls and bears. When the price operates above the dividing line, it indicates that the bullish forces are dominant, and market sentiment is optimistic; when the price breaks below the dividing line, it suggests that bearish forces are beginning to strengthen, and the market may enter an adjustment phase. Investors can use the relative position of the price to yesterday's bull-bear dividing line to judge the short-term trend of the market and formulate corresponding investment strategies.
3. Interpretation of Technical Indicators
(1) Bollinger Bands (BOLL)
The current Bollinger Bands indicator for ETH shows that the bands are opening upward, with the price running between the middle and upper bands. This indicates that the market is generally in an upward trend, but the price has experienced a correction after touching the upper band. The position of the lower band can serve as another important support reference, currently located near 3093.00. If the price approaches the lower band during the correction and shows significant signs of stopping the decline, it may represent a good buying opportunity.
(2) Moving Average (MA)
As seen from the chart, the 5-day moving average (MA5) and the 10-day moving average (MA10) are gradually flattening during the price correction. When the short-term moving averages flatten, it often indicates that the short-term trend of the market may change. If the price can stabilize above the 5-day and 10-day moving averages, it may suggest a continuation of the short-term upward trend; conversely, if the price continues to operate below the moving averages, the risk of decline will further increase.
Follow me to make more confident investment decisions. The crypto market fluctuates, and Zhuque will accompany you!

