

Ethereum moved above $3,125 and followed a clean price curve that points to a projected $4,000 target.
RSI formed a bowl pattern over time and this matches Ethereum’s rise after breaking the $2,855 zone.
A rounded base structure and fractal support suggest that ETH may soon approach the $4,000 level cleanly.
Ethereum has surged to $3,125 following a clean breakout from consolidation, with technical indicators now pointing toward a possible $4,000 target. A bowl-shaped RSI structure and a rounding price base have aligned closely, confirming bullish momentum. Traders are watching the $2,855 support for strength and $4,000 for the next major resistance.
 Source: X Clean Breakout Above $2,855 Triggers Bullish Continuation
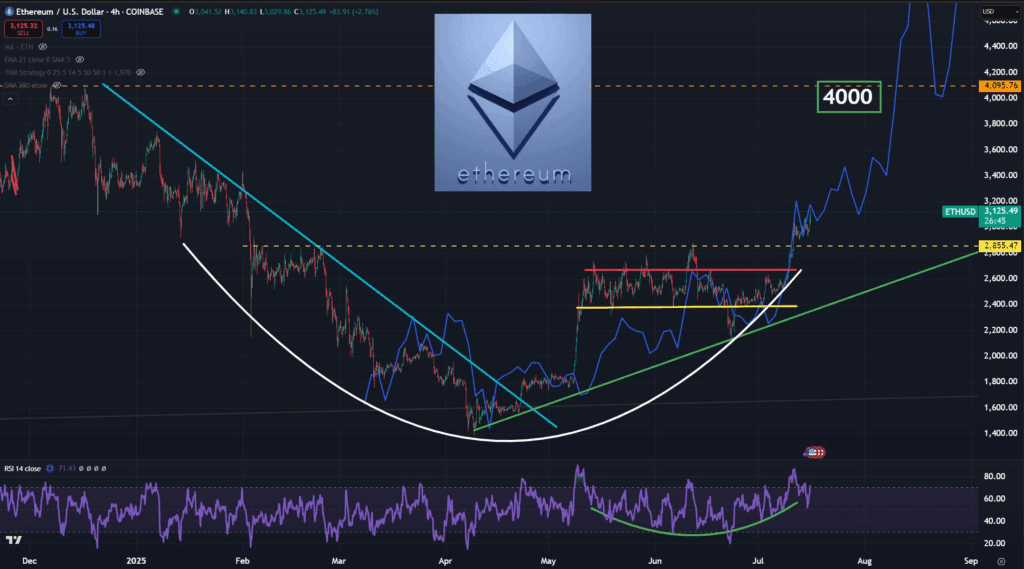
The 4-hour ETH/USD chart shows a significant breakout above the horizontal resistance zone marked at $2,855. This range capped price action for over two months, forming a horizontal consolidation structure. Ethereum recently moved above it with increased momentum, confirming the end of that range-bound phase.
The green ascending trendline has acted as support since April and intersects with the breakout point. Price action respected this line multiple times before lifting off. The current structure resembles a rounded bottom, which often forms at the base of large trend reversals.
An earlier descending resistance line, shown in blue, was broken in May. Price then moved sideways while forming the base of the bowl pattern. This setup built bullish pressure as each pullback formed higher lows, eventually pushing price above $3,125 with a clean break.
RSI Bowl Confirms Momentum Shift With Strong Upside Follow-Through
The Relative Strength Index (RSI) at the bottom of the chart shows a textbook bowl-shaped curve. The RSI value now reads 71.43, moving into overbought territory. The bowl’s curve formed over months and indicates strengthening buyer interest and reduced selling volume.
This RSI fractal was referenced by analysts including Chris (@StonkChris), who noted Ethereum’s structure is the cleanest across all crypto assets. TommyJR echoed that view, stating the RSI bowl was a “delicious spot” to observe a turning point. The signal closely matches prior bottoming behavior seen before strong rallies.
The RSI’s gradual slope followed price formation, reinforcing confidence in the breakout structure. Historical patterns show similar RSI bowls have supported large moves. With price and RSI now climbing in sync, the probability of Ethereum continuing toward $4,000 has increased.
The symmetry between RSI behavior and price development suggests strong technical alignment. This coordination often results in sustained trends once resistance is broken. If momentum holds, the $4,000 level may act as the next major psychological and structural test.
Can Ethereum Sustain Momentum and Reach the $4,000 Target?
Ethereum’s recent rally follows months of structured buildup, marked by repeated tests of the $2,855 zone. The breakout, combined with an RSI bowl and rounded price base, gives the rally a strong technical foundation. Analysts now focus on whether momentum can push ETH to $4,000.
The blue projected path on the chart shows a curved move leading to $4,000, based on fractal tracking. The fractal compares closely with past Ethereum patterns that preceded large trend expansions. Price is currently following that projection closely, confirming the model’s relevance.
If Ethereum remains above $3,125 and uses the breakout as new support, further upside appears technically viable. The $2,855 area now becomes a critical level to defend for bulls. With RSI above 70 and price structure holding firm, Ethereum could see a new leg higher—will $4,000 arrive sooner than expected?
