The candlestick chart is a commonly used technical analysis tool that can be used to judge stock price trends and predict trends in the cryptocurrency market. Candlesticks are equivalent to those in other financial industries, and by analyzing different patterns and indicators, one can determine buy and sell signals. For investors to trade in the cryptocurrency market, it is essential to understand this in order to trade better in the market. However, many beginners do not know how to read the buy and sell signals in the cryptocurrency market. Today, let's learn how to read the candlestick chart.

Concept: The candlestick chart is a graph that displays the price trends of digital currencies in rectangular shapes. Each rectangle is called a candlestick and is composed of four key price points: opening price, closing price, highest price, and lowest price.
The candlestick chart can show price fluctuations over different time periods, such as minutes, hours, days, weeks, etc.
Upward signal: When the price breaks through upward from the 10-day, 20-day, 50-day, or 200-day moving average, this is an upward signal.
Downward signal: Below the moving average: If the price breaks below the short-term or long-term average line, it indicates the beginning of a downward trend.
(1) Line chart (Line) (2) Candlestick chart
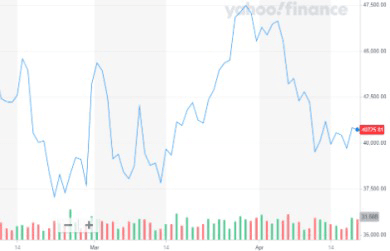
The candlestick chart actually represents the fluctuations of currency prices over a period of time with candlesticks. The highest points of rise and fall in a day are called the rising line. The lowest points of rise and fall in a day are called the falling line.
In this cryptocurrency candlestick chart, green indicates an upward trend and red indicates a downward trend. Through color and upper shadow lines, investors can quickly determine the price fluctuations during a certain period.
The candlestick chart shows the rises and falls of the day. By observing the candlesticks, one can determine the buying and selling power of both sides for that day, thus inferring the trend.
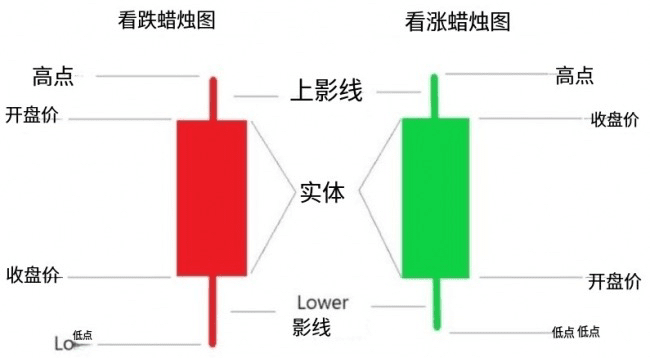
Understand the basic elements of candlesticks: A candlestick consists of a body and lines. The body refers to the price range between the opening and closing prices, usually dominated by red (downward) and green (upward); the shadow reflects the price fluctuations at the high and low positions.
Observe the trend: Through the trend of the candlestick chart, you can know whether the current market trend is upward, downward, or sideways. If it is a long-term upward trend, consider buying; if it is a long-term downward trend, consider watching or selling.
Analyze support and resistance: Support (which may provide support when prices fall) and resistance (which may encounter resistance when prices rise) are determined by the candlestick chart. When the price approaches the support level, it is a good time to buy; near resistance, it may also be a good time to sell.
I am Ah Yue, focused on analysis and teaching, a mentor and friend on your investment journey! May everyone investing in the market sail smoothly, as an analyst, the most basic thing is to help everyone make money. I will help you resolve confusion, locked positions, and provide operational advice, speaking with strength. When you are lost and don’t know what to do, look at Ah Yue (homepage) for guidance.

