🔹 Bullish Candlestick Patterns – Signs of Trend Reversal:
These candlesticks usually appear after a downtrend and signal growing buyer strength. Recognizing them helps traders anticipate potential upward moves.
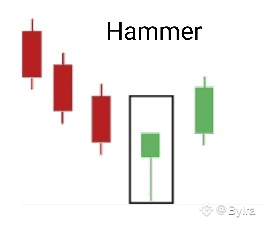
1. Hammer:
Small body on top, long lower wick
🧭 Why it forms: Sellers push price down but buyers regain control.
📈 Effect: Possible bullish reversal after downtrend.
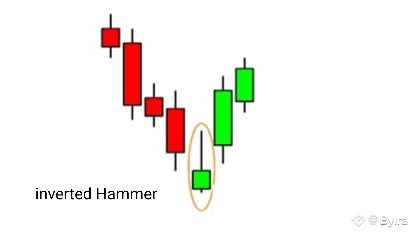
2. Inverted Hammer:
Small body at bottom, long upper wick.
🧭 Why it forms: Buyers test upside after selling pressure.
📈 Effect: Bullish reversal likely if followed by a strong green candle.
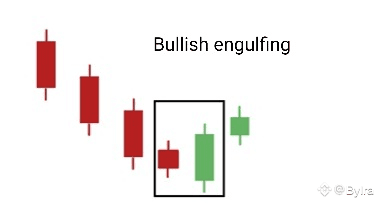
3. Bullish Engulfing:
Green candle completely engulfs prior red candle.
🧭 Why it forms: Strong buyer dominance.
📈 Effect: Clear sign of trend reversal upward.
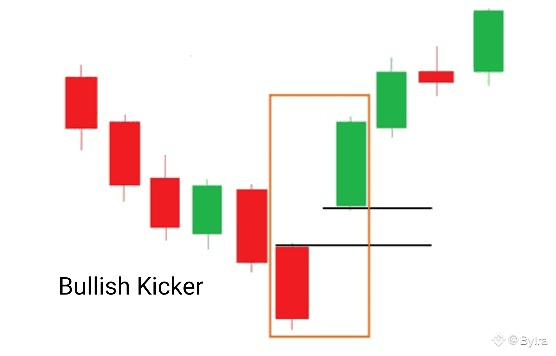
4. Bullish Kicker:
Green candle opens above previous red with a gap.
🧭 Why it forms: Sudden shift in sentiment.
📈 Effect: One of the strongest bullish signals.
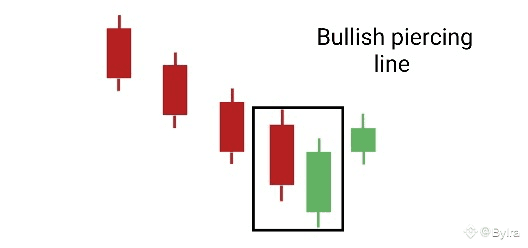
5. Bullish Piercing Line:
Green candle opens below red candle but closes over halfway into its body.
🧭 Why it forms: Buyers recover momentum.
📈 Effect: Positive reversal signal.
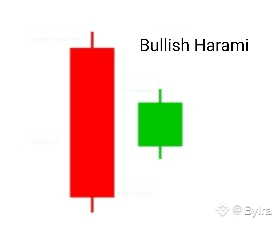
6. Bullish Harami:
Small green candle inside prior large red one
🧭 Why it forms: Selling pressure weakens
📈 Effect: Reversal potential – confirmation needed.
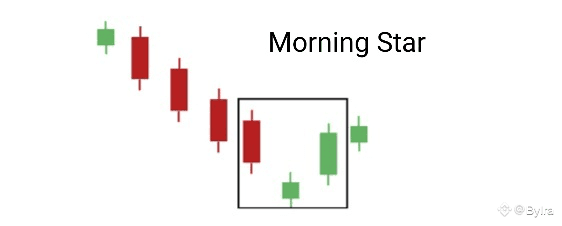
7. Morning Star:
Three candles: red → small candle → large green.
🧭 Why it forms: Selling slows, buying resumes.
📈 Effect: Strong bullish reversal.
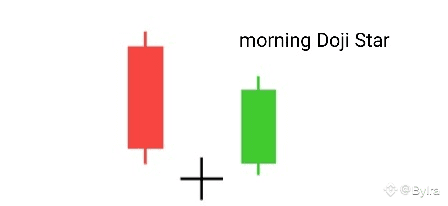
8. Morning Doji Star:
Like Morning Star, but with a doji as the middle candle.
🧭 Why it forms: Market hesitation then strong buying.
📈 Effect: Even stronger reversal signal.
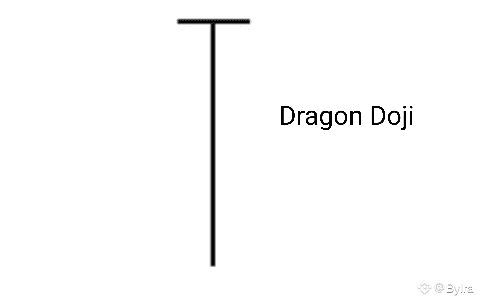
9. Dragonfly Doji:
No upper wick, long lower wick.
🧭 Why it forms: Sellers dominated but failed to hold control.
📈 Effect: Bullish if confirmed with next candle.
📌 In Part 2, we’ll explore the most powerful bearish reversal patterns and how to interpret them.
#Lesson3 #part1 #BullishCandlesticks #CryptoEducation💡🚀 #BinanceSquare


