Introduction
#SupplyAndDemand are the fundamental forces that drive market prices. By understanding how these zones form and how to trade them effectively, traders can gain a significant edge in the market.
In this guide, you’ll learn:
What supply and demand zones are
How they are created
How to identify high-probability zones
A proven trading strategy to profit from them
What Are Supply and Demand Zones?
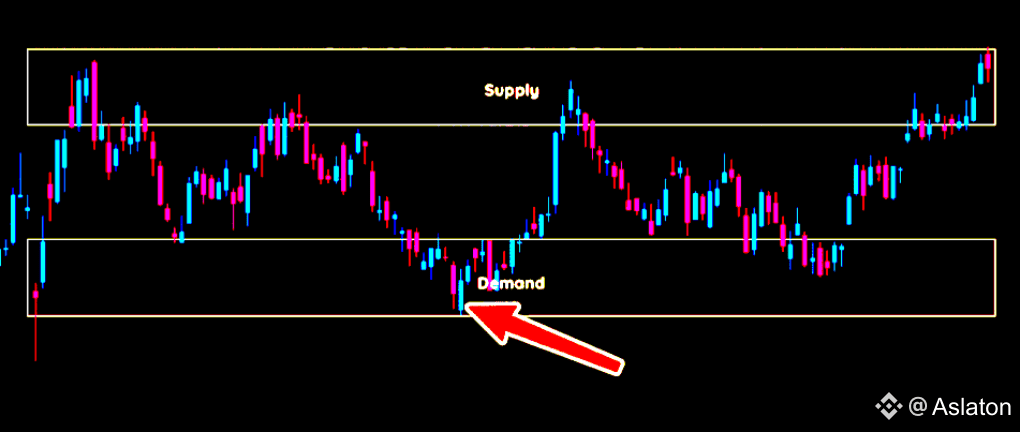
Supply and demand zones are areas on a price chart where significant buying (demand) or selling (supply) activity has occurred, leading to strong price movements.
Demand Zone: A price level where buyers step in aggressively, pushing prices up.
Supply Zone: A price level where sellers dominate, driving prices down.
These zones form due to imbalances between buyers and sellers, often caused by institutional traders (smart money).
How Are Supply and Demand Zones Created?
Markets move in cycles: ranging (consolidation) and trending (breakout) phases.
1. Ranging Markets (Consolidation)
When price moves sideways, it oscillates between:
Premium Zone (Overpriced): Buyers lose interest, leading to selling pressure (supply).
Discount Zone (Underpriced): Sellers exhaust, leading to buying pressure (demand).
Eventually, the market breaks out of this range due to institutional activity, creating a new trend.
2. Breakout & Retest (Imbalance Creation)
When price breaks out of consolidation, it indicates a strong imbalance:
Supply Zone: Created when price breaks down aggressively from consolidation.
Demand Zone: Created when price breaks up aggressively from consolidation.
After the breakout, price often retests the zone to fill remaining orders before continuing the trend.
How to Draw Supply and Demand Zones
There are two main methods:
1. Range Method
Mark the entire consolidation area before the breakout.
Draw a box from the highest to lowest point of the range.
Extend the zone to the right for future reference.
Example:
If price consolidates and then breaks down, the entire range becomes a supply zone.
If price consolidates and breaks up, the range becomes a demand zone.
2. Pivot Method (More Precise)
Instead of marking the whole range, focus on the pivot candle (the candle that triggered the breakout).
Advantage: Tighter stop loss, better risk-reward.
Disadvantage: Higher chance of missing the trade if price doesn’t retest the exact pivot.
How to Identify High-Probability Zones
Not all zones are equal. The best zones have:
1. Break of Structure (BOS)
A strong move that breaks past key highs/lows, confirming trend continuation.
Example: In an uptrend, a demand zone that leads to a higher high is high-probability.
2. Flip Zones (Failed Zones Become New Zones)
When a supply zone fails (price breaks above it), it often flips into a demand zone.
This indicates a shift in market sentiment.
Additional Confluences (Increase Probability)
Market structure alignment (trend confirmation)
Multi-timeframe analysis (zones aligning on higher timeframes)
Liquidity sweeps (price hunting stops before reversing)
Fresh vs. mitigated zones (fresh zones have higher success rates)
Proven Supply & Demand Trading Strategy
Step 1: Identify Market Direction
Look for higher highs & higher lows (uptrend) or lower highs & lower lows (downtrend).
Only trade with the trend for higher success.
Step 2: Mark Key Supply/Demand Zones
Use range or pivot method to mark zones.
Focus on zones that caused strong breakouts or reversals.
Step 3: Wait for Price to Retest the Zone
Buy at demand zones in an uptrend.
Sell at supply zones in a downtrend.
Step 4: Enter with Confirmation
Look for price rejection (wicks, engulfing candles) at the zone.
Enter with a stop loss below demand (for buys) or above supply (for sells).
Step 5: Take Profit at Next Opposing Zone
If buying at demand, take profit at the next supply zone.
If selling at supply, take profit at the next demand zone.
Example Trade Setup
Buy Trade Example
Trend: Uptrend (higher highs & higher lows).
#DemandZones : Price consolidates, then breaks up aggressively.
Entry: Price retests demand zone, forms bullish rejection.
Stop Loss: Below the demand zone.
Take Profit: At the next supply zone.
Sell Trade Example
#Trend : Downtrend (lower highs & lower lows).
#SupplyZones : Price consolidates, then breaks down aggressively.
Entry: Price retests supply zone, forms bearish rejection.
Stop Loss: Above the supply zone.
Take Profit: At the next demand zone.
Final Thoughts
Supply and demand trading is a powerful strategy used by institutional traders. By mastering:
Zone identification
High-probability setups
Proper risk management
You can trade like the top 1% instead of falling into the 90% of traders who lose money.
Next Steps
Practice on historical charts.
Combine with liquidity concepts for stronger setups.
Stay disciplined—only trade high-probability zones.
By applying these principles, you’ll be on your way to consistent profits in the markets.
Happy Trading! 📈
