📊 Current technical signals (Investing.com).
According to data from Investing.com as of July 16, 2025:
Technical indicators:
RSI(14) ≈ 50.6 → neutral.
Stochastic shows a tendency to sell, while StochRSI indicates oversold.
Neutral MACD.
ADX, Williams %R, CCI, ROC, and Bull/Bear Power point to Sell.
Moving averages:
Short-term (5,10,20): Sell signals.
Medium and long term (50,100,200): Buy.
🔄 Trend context (TradingView)
On TradingView, the analysis for the PIXEL/USDT pair shows:
Daily signal: “Buy”, reflecting recent momentum.
In weekly and monthly horizons, the signal is Neutral.
The propensity to buy in the short term aligns with the bounce from the support zone, although there is no alignment in long-term oscillators.
✅ Conclusion of technical analysis
Horizon Technical signal
Short term Neutral–Bearish trend Possible bounce from support, but without bullish confirmation.
Medium term Neutral Catalysts are lacking; mixed signals and no clear momentum.
Long-term Slightly bullish Long moving averages point upward, but resistance levels need to be broken.
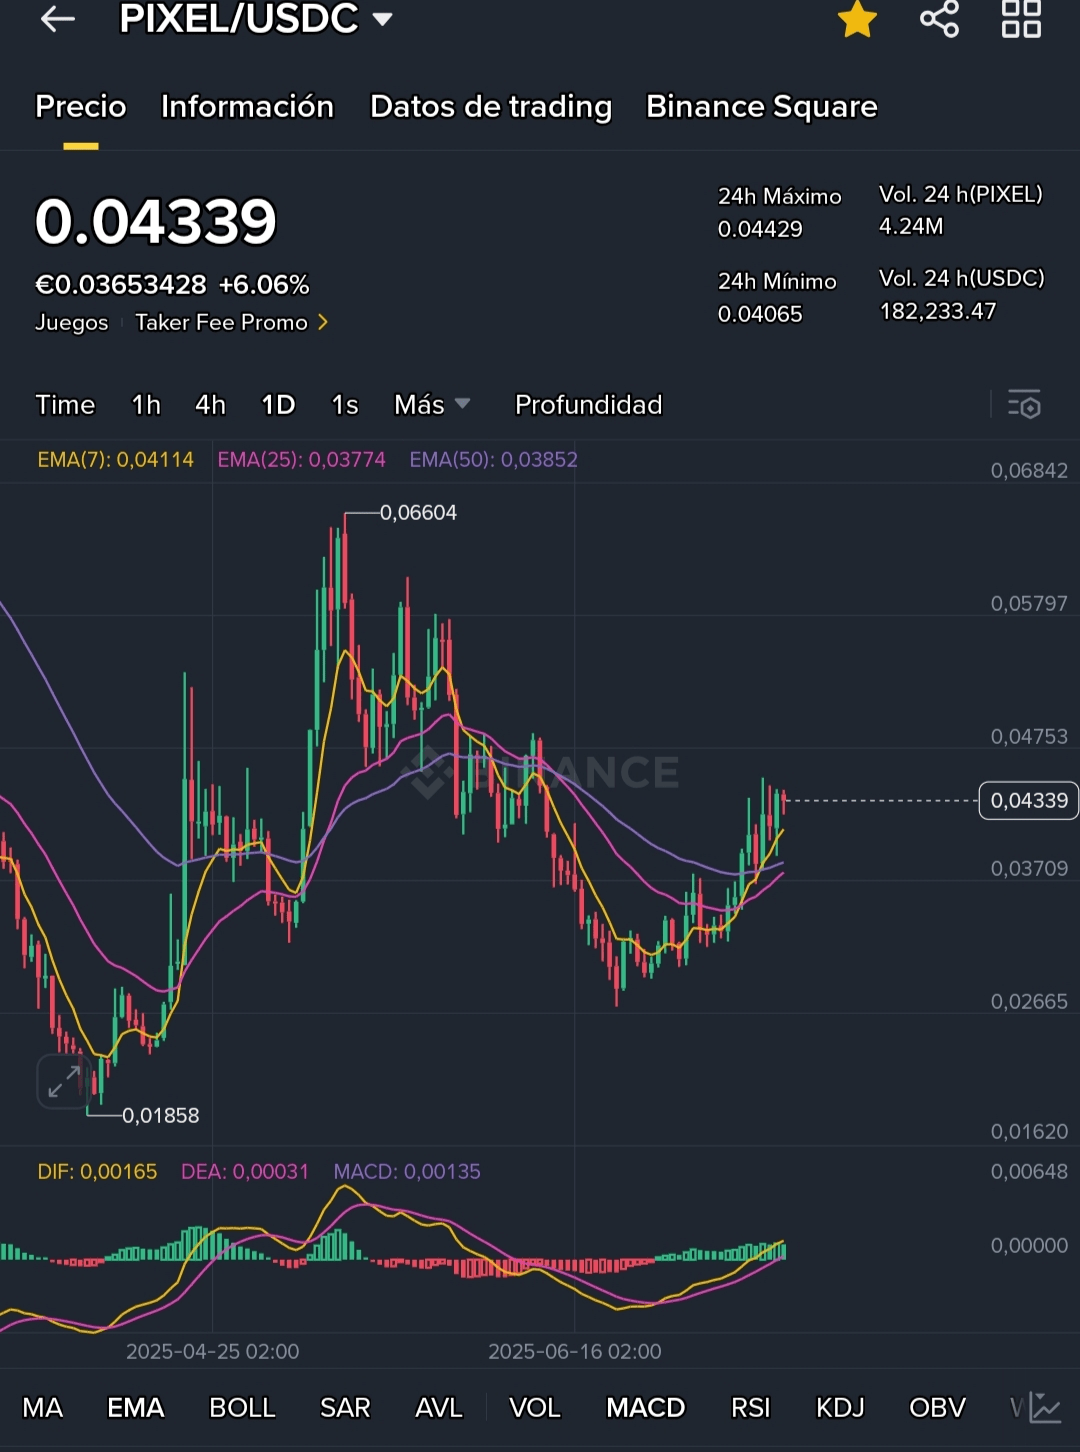
Supports: around the 50–200 MA (~$0.041‑0.039).
Resistances: pivots close to $0.043–0.044 (recent highs).
Technical recommendation:
Enter support zones if reversal candles and volume confirmation appear.
Consider partial exit if it surpasses daily highs (~$0.044‑0.045) without confirmation.
Use stops below $0.039 to limit risk.
🔍 Suggested strategy
1. Intraday/swing trading: wait for consolidation between $0.041–0.044, look for bounce signals.
2. Long-term positioning: monitor the 200-day moving average (~$0.0396) — a firm breakout above would reinforce a bullish scenario.
3. Key levels:
Main support: $0.041–0.039.
Immediate resistance: $0.044–0.045.
4. Additional useful indicators:
Volume: confirm bounces.
RSI 14 and daily MACD: would improve the signal.