Introduction:
In the trading world, whether you are dealing with stocks, cryptocurrencies, or forex, knowing where the price can stop and reverse direction is one of the essential skills for every successful trader. This is where support and resistance areas come into play, which are indispensable technical analysis tools to understand market behavior and make informed decisions.
---
What is a support area?
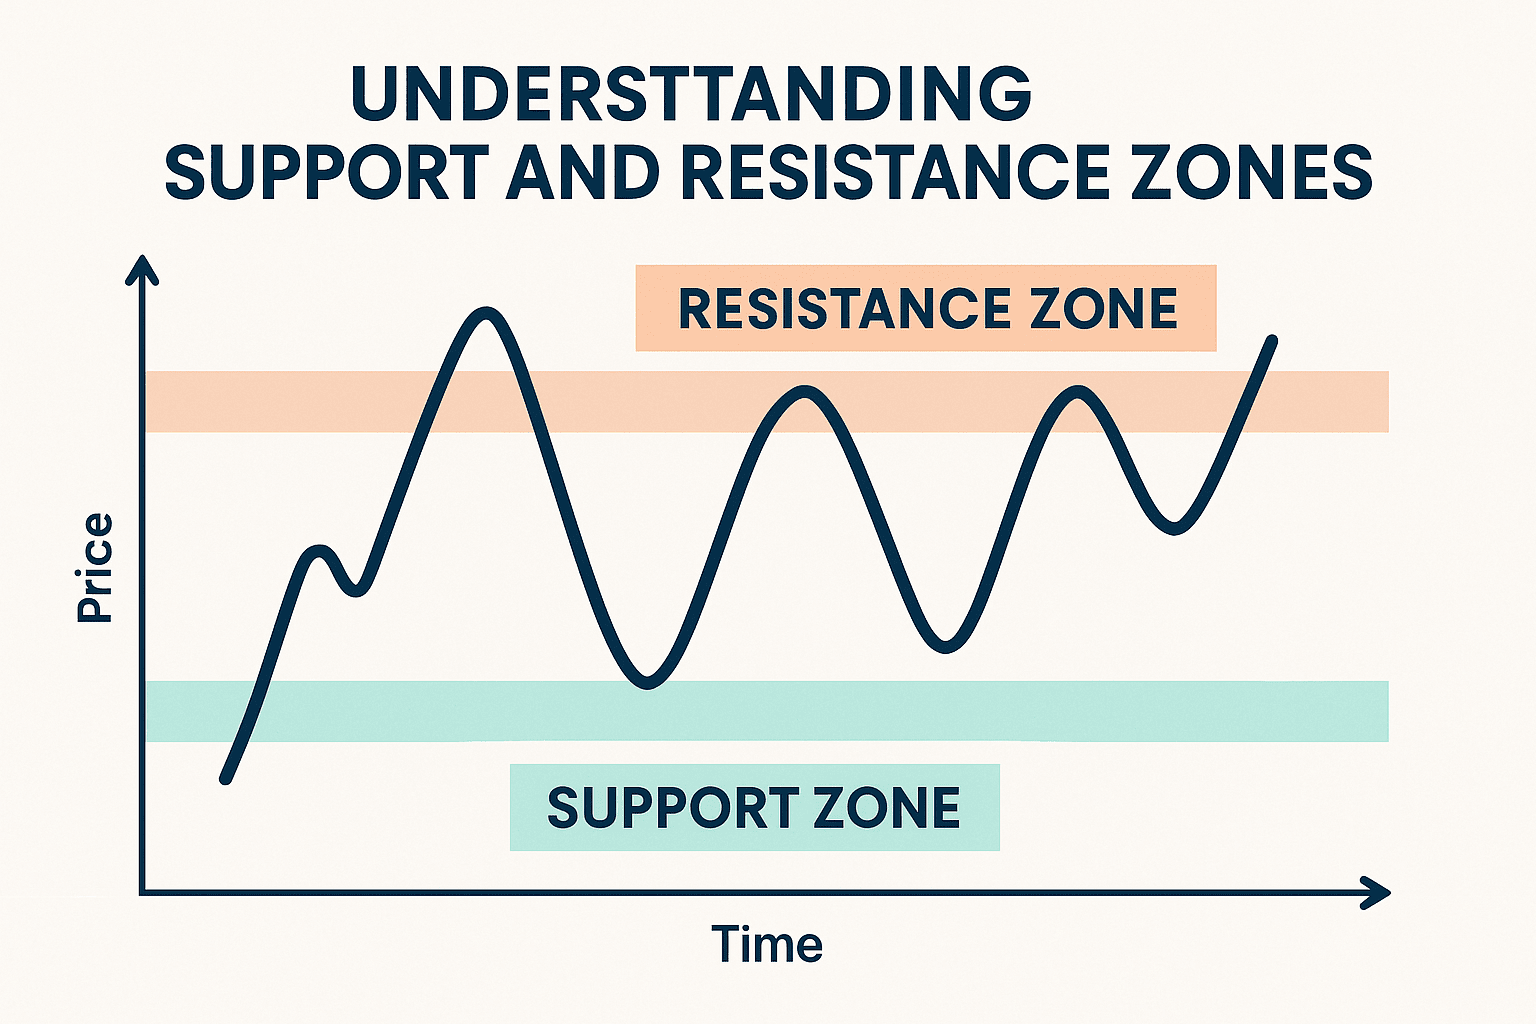
The support zone is a price level or range expected to halt the price's decline and lead to an upward reversal.
Simply put, it is the market floor. When the price drops and approaches this area, buyers intervene strongly, creating buying pressure that prevents the price from dropping further.
🔹 Examples of support:
The lowest price the asset reached during a specific time period.
A psychological level like $100 or $1,000.
Long moving averages like the 200-day.
🧠 Why does it happen?
Because investors remember these prices as good buying levels, or because they represent an ideal entry point for large institutions.
---
What is a resistance area?
The resistance zone is a price level or range expected to halt the price's rise and lead to a downward reversal.
It is the market ceiling, and when the price reaches it, sellers start to appear strongly, leading to selling pressure that prevents the price from rising further.
🔹 Examples of resistance:
The highest price reached during a certain time frame.
Price levels intersecting with certain technical indicators.
Downtrend lines (Trendlines).
🧠 Why does it happen?
Because many traders take this price as a point for profit-taking or entering sell trades.
---
The difference between "level" and "area":
🔸 The level means a specific price point (e.g., $30,000).
🔸 The area means a price range (e.g., between $29,800 and $30,200), and it is more accurate and realistic because the price rarely reverses from exactly one point.
---
How to identify support and resistance areas?
1. Chart Timeframe:
Use different time frames (daily, weekly, 4 hours) for a comprehensive view.
2. Previous highs and lows:
Look for areas where the price has reversed multiple times; these are usually strong support/resistance areas.
3. Volume:
When trading volumes increase at a certain level, it enhances the strength of support or resistance.
4. Technical Indicators:
Such as RSI, Bollinger Bands, and Fibonacci Retracement to confirm areas.
---
Using support and resistance in trading:
🔹 Buy near support and sell near resistance.
Example: If the price of an asset reaches a strong support area and positive technical signals appear, this may be a good buying opportunity.
🔹 Breakout:
When the price breaks through a strong resistance area, it is often followed by a significant rise, and vice versa if it breaks a support area.
🔹 Reversal:
If the price fails to break resistance and starts to drop, it may be an opportunity to enter a sell trade.
---
Professional tips:
✅ Do not rely solely on support and resistance; use them with other indicators for confirmation.
✅ The strongest levels are those that have been tested multiple times.
✅ Volatile markets may temporarily exceed support/resistance, then return to them.
✅ Broken support turns into resistance, and broken resistance becomes new support.
---
Conclusion:
Support and resistance are not just lines on the chart but reflect market sentiment and investor expectations. Mastering the analysis of these areas gives you a real competitive advantage in the trading world and helps you make more accurate and less random decisions.
