The Solana-based coin $BONK shows no signs of retracement as market capitalization rises by 55% in July
The meme coin Bonk extends its recovery above $0.00003300, supported by stable risk sentiment in the broader cryptocurrency market.
The golden crossover confirmed by the 50-day exponential moving average crossing above the 100-day exponential moving average supports the strong bullish structure.
Investor appetite for Bonk remains stable, with an increase in open interest in futures and trading volume occurring simultaneously.
The Bonk coin ($BONK ) continues to gain upward momentum, distinguishing itself among other meme coins with daily increases exceeding 12% on Wednesday. Following a 110% rise over the past thirty days, Bonk is trading at around $0.00003377 at the time of writing. The rise of Bonk has had a positive impact on market capitalization, which recorded a 55% increase in July to reach $2.55 billion, according to Coin Gecko.
Bonk maintains an upward trend amid strong investor appetite
Bonk enjoys a stable technical structure, which, according to Coin Glass data, is supported by a strong derivatives market. Open interest in futures (OI), representing the value of all unsettled or closed futures and options, has surged since the beginning of this month, averaging $48 million.
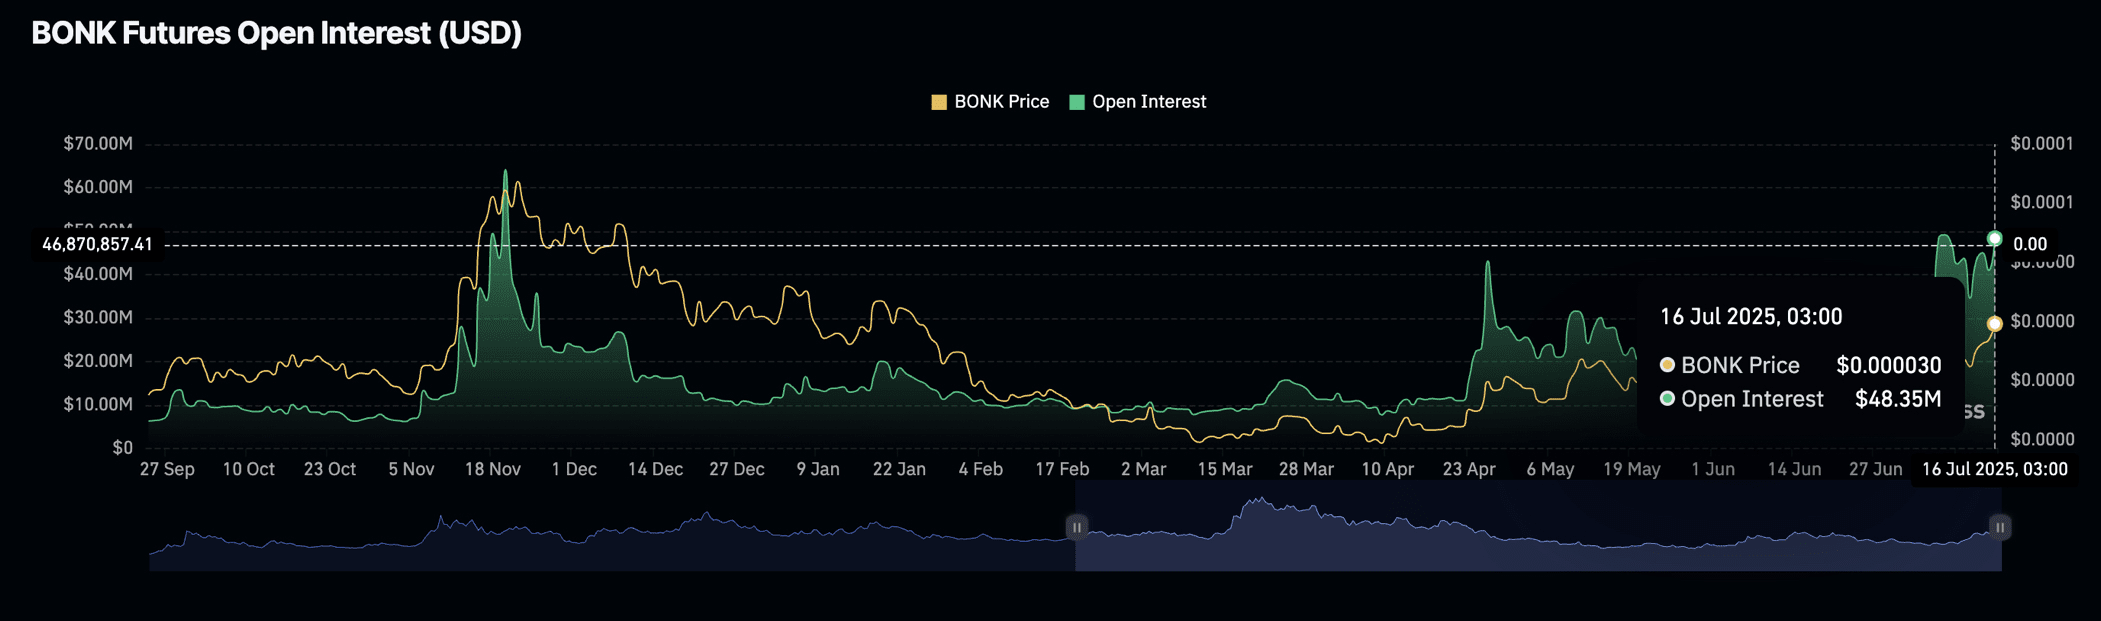
Open interest data for Bonk futures | Coin Glass
A subsequent increase in derivatives trading volume, from around $39 million to $618 million during the same period, highlights the ongoing interest in Bonk. The rise in open interest alongside the volume indicates a higher risk appetite and increased investor confidence in the ecosystem.
The price of Bonk has the potential to extend the upward trend towards resistance at $0.00004000 if the derivatives market maintains its upward trajectory in the coming days or weeks.

Bonk futures trading volume | Coin Glass
Technical outlook: $BONK maintains the bullish structure
The recovery in Bonk's price remains firm at the time of writing, having gained for five consecutive days. The Moving Average Convergence Divergence (MACD) indicator has maintained a buy signal since June 28, supporting the bullish momentum. This signal is characterized by the crossing of the blue MACD line above the red signal line, while the green histogram bars expand above the zero line, encouraging traders to increase their exposure.
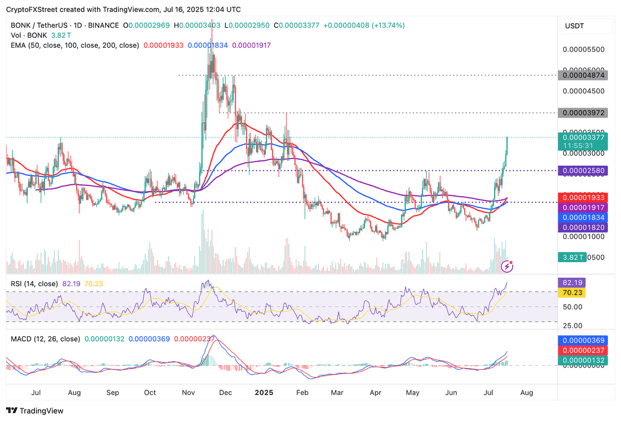
Daily chart of Bonk/USDT
Confirmation of the golden crossover when the 50-day exponential moving average crossed above the 100-day exponential moving average on Saturday reinforces the bullish technical structure.
Traders are likely to hold their long positions in anticipation of Bonk's price rising further towards the short-term target at $0.00004000 and $0.00005000 in the near term.
However, traders should adjust their expectations, especially considering that the Relative Strength Index (RSI) is in overbought territory, which could lead to a trend reversal as the market heats up. It is worth monitoring the movement of the RSI to assess the strength of the upward trend, noting that a reversal to the neutral zone indicates reduced buying pressure.
Key levels to watch and prepare for, as temporary support, are $0.00003000, which was tested in December, and the convergence of the 50-day exponential moving average and the 200-day exponential moving average at around $0.00001935.
#BinanceSquare #Write2Earn #Write2Earn! #BinanceHerYerde #BinanceExplorers

