Wıf / USDT 1D – Technical Analysis)
📊 Overall View:
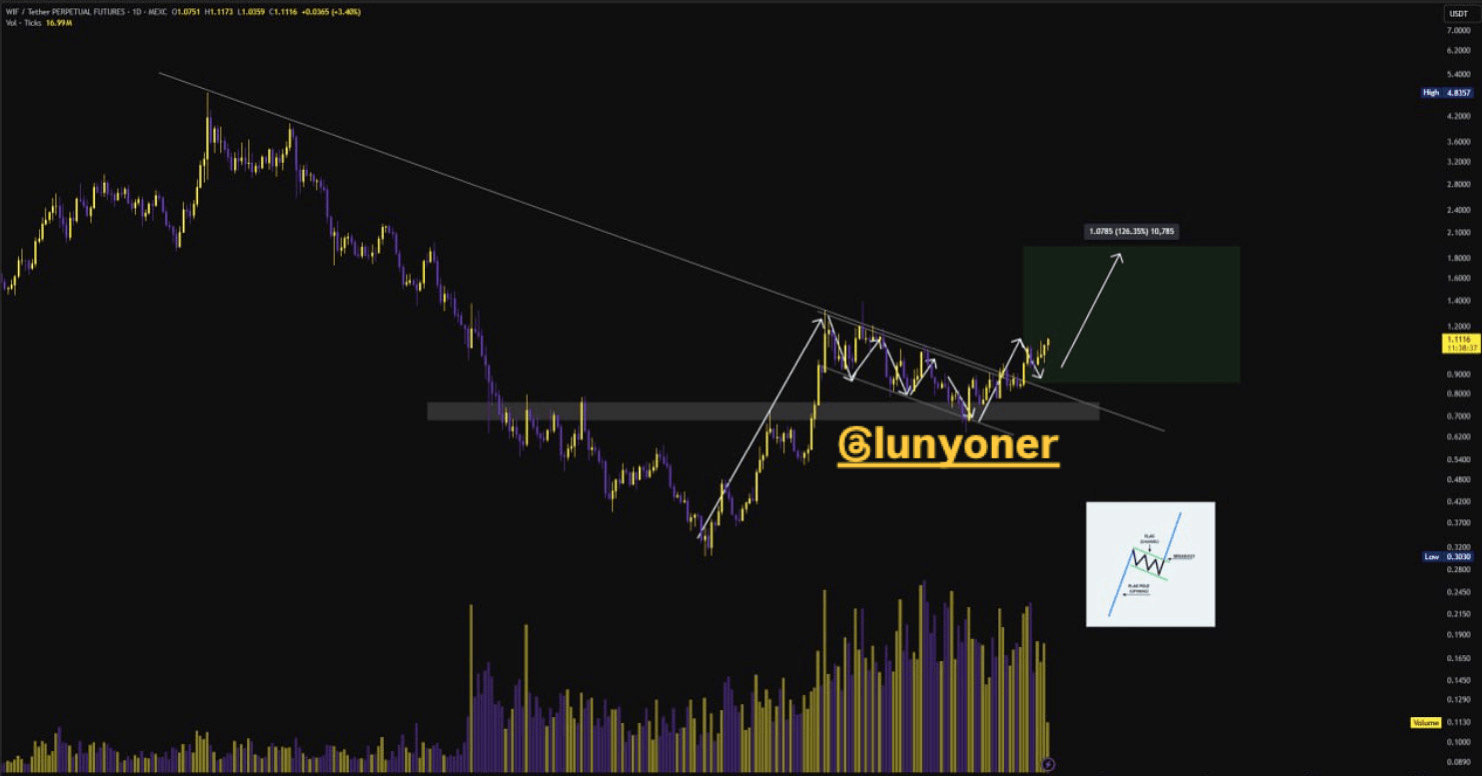
A long-term downtrend has clearly been broken on the chart, and then a bull flag formation has emerged. This formation has broken with strong volume and it is likely that a new upward wave will begin along with the flagpole.
🎯 Target and Prices:
Current price: 1.11 USDT
Short-term target: 1.40 USDT
Medium-term target: range of 1.70 – 2.00 USDT
Formation target: 2.20 USDT (according to flagpole measurement)
📌 Support – Resistance Areas:
Support 1: 0.95 – 1.00 USDT (formation breakout retest area)
Support 2: 0.84 – 0.88 USDT (previous consolidation area)
Resistance 1: 1.25 – 1.40 USDT
Resistance 2: 1.70 USDT
Main resistance: 2.20 USDT
📈 Formation and Structure:
Bull Flag: has clearly formed, a volume breakout has occurred.
Trend breakout: long-term downtrend has been broken → this breakout provides strong confirmation as it is combined with the formation.
Flagpole measurement: potential of %120+
📉 Volume and Indicators:
Volume: breakout candle has high volume, followed by sideways movement in average volumes → there is no healthy pullback, indicating that buyers are still strong.
RSI: Although it approaches the overbought zone, there is no clear peak signal.
MACD: may have produced a buy signal after positive divergence (hypothetical comment)
📊 Time Frame and Trend:
4H: Flag formation retest has been completed → bullish on a micro level.
1D: Main upward trend has started → positive in the medium term.
1W: High potential for an uptrend in the coming weeks → positive.
📍 Roadmap / Strategy Plan:
Scenario 1 – Trend continuation (main scenario):
Buying zone between 1.05-1.10 (breakout + retest)
Targets: 1.40 → 1.70 → 2.20
Stop: daily close below 0.95
Scenario 2 – Loss of support:
Formation will break on a close below 0.95
Possible pullback: down to 0.88 – 0.84
These areas could be re-entry opportunities
⚔️ Trade Strategy (Example Plan):
Long Entry: range of 1.08 – 1.11
Stop-Loss: 0.95
Take Profit 1: 1.40 (first resistance)
Take Profit 2: 1.70
TP3 – Final target: 2.20 (formation target)
Risk/Reward ratio (R:R) can be evaluated as approximately 3.0+.
📌 Conclusion & Comment:
@lunyoner states that this chart, along with the classic technical analysis formation of a bull flag, is supported by strong volume and a breakout. This could be a trend reversal with the break of the long-term downtrend.
Plan for the investor:
As long as the main support is not lost, the trend remains positive.
Without FOMO, support retest areas should be monitored.
As long as the sideways accumulation structure is not broken, the uptrend may continue.
Should be added to the watchlist and breakouts confirmed by volume should be considered as buying opportunities.