
Date: Wed, July 16, 2025 | 06:36 AM GMT
The cryptocurrency market is deep in bullish territory, with Ethereum (ETH) continuing its upside move with an impressive 19% gain over the week — now approaching the $3,150 mark. This strong uptrend is spilling over into major memecoins, and Official Trump (TRUMP) is starting to grab attention.
$TRUMP has jumped 9% over the past seven days, but what’s catching even more attention now is the emergence of a textbook harmonic pattern on the chart that may point to further gains ahead.

Source: Coinmarketcap
Harmonic Pattern Hints at Bullish Continuation
On the 4-hour chart, TRUMP is forming a Bearish ABCD harmonic pattern — a classic setup that often precedes a short-term rally before a potential reversal. The pattern started around July 8 from point A, followed by a strong rally to point B near $10.41. It then retraced down to point C at approximately $8.99 in mid-July.
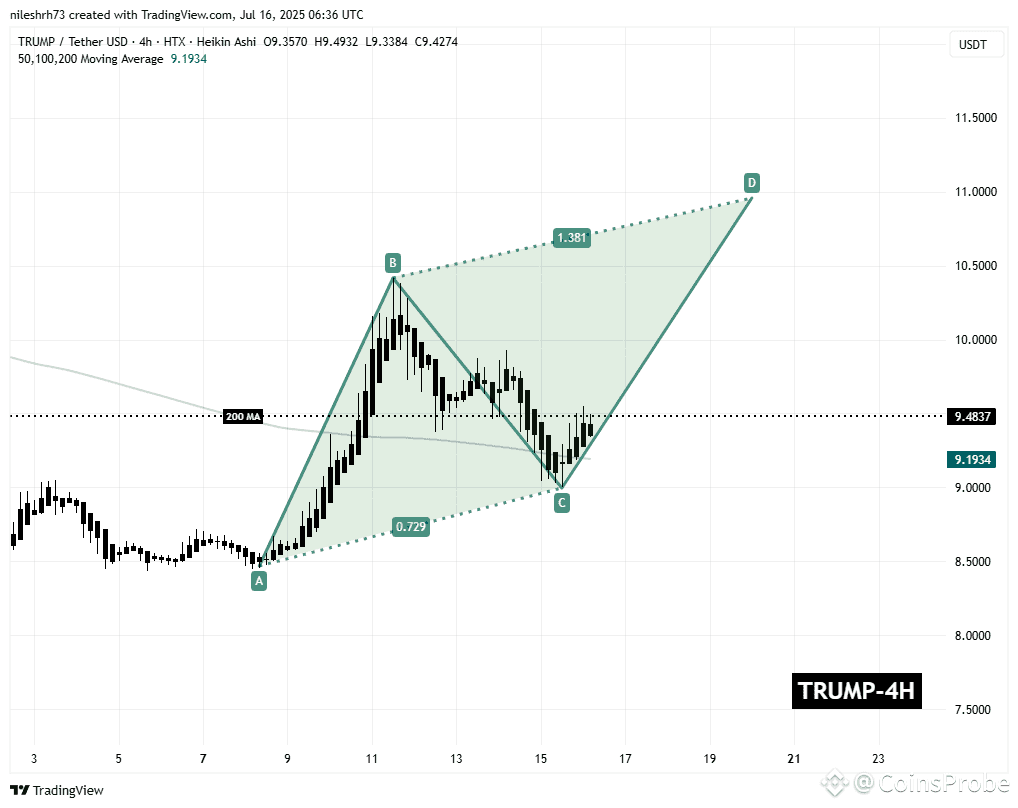
Official Trump (TRUMP) 4H Chart/Coinsprobe (Source: Tradingview)
Since then, TRUMP has bounced and is now trading near $9.48, regaining momentum. The current leg from point C to point D is unfolding, and if the harmonic pattern completes as expected, the target (point D) aligns with the 1.381 Fibonacci extension, pointing to $10.95 — a potential 15% move from current levels.
What’s Next for TRUMP?
If this bullish harmonic structure plays out fully, TRUMP could rally toward the Potential Reversal Zone (PRZ) around $10.95. This level could act as a critical resistance where profit-taking may occur, based on past pattern behavior.
On the downside, holding above the 200-period moving average, currently near $9.19, is key for maintaining the structure. A breakdown below this level may weaken the pattern and open the door for short-term bearish pressure.
Disclaimer: This article is for informational purposes only and not financial advice. Always conduct your own research before investing in cryptocurrencies.


