Only 0.3% of them made over million
I meet mostly traders and was shocked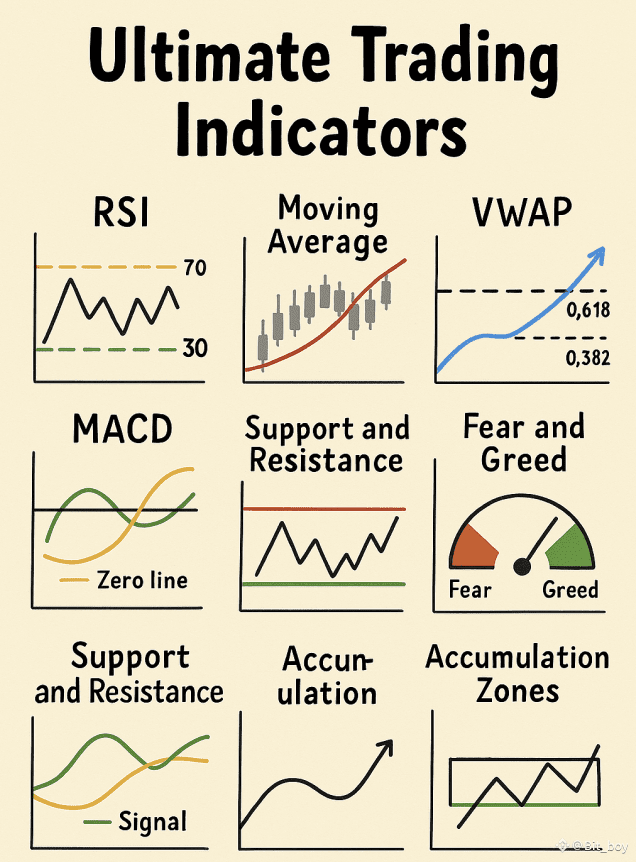
1/ ➮
Indicators don’t predict the future perfectly, but they show key signals
If you know how to read them properly, you can follow the market cycle with confidence
I’ve summarized the most useful indicators that work today
2/ ➮
RSI measures momentum and identifies overbought or oversold conditions
Above 70 = overbought (risk of reversal)
Below 30 = oversold (potential bounce)
I use RSI to catch reversal setups when price hits key support or resistance
Best signals come when RSI diverges from price at extremes. 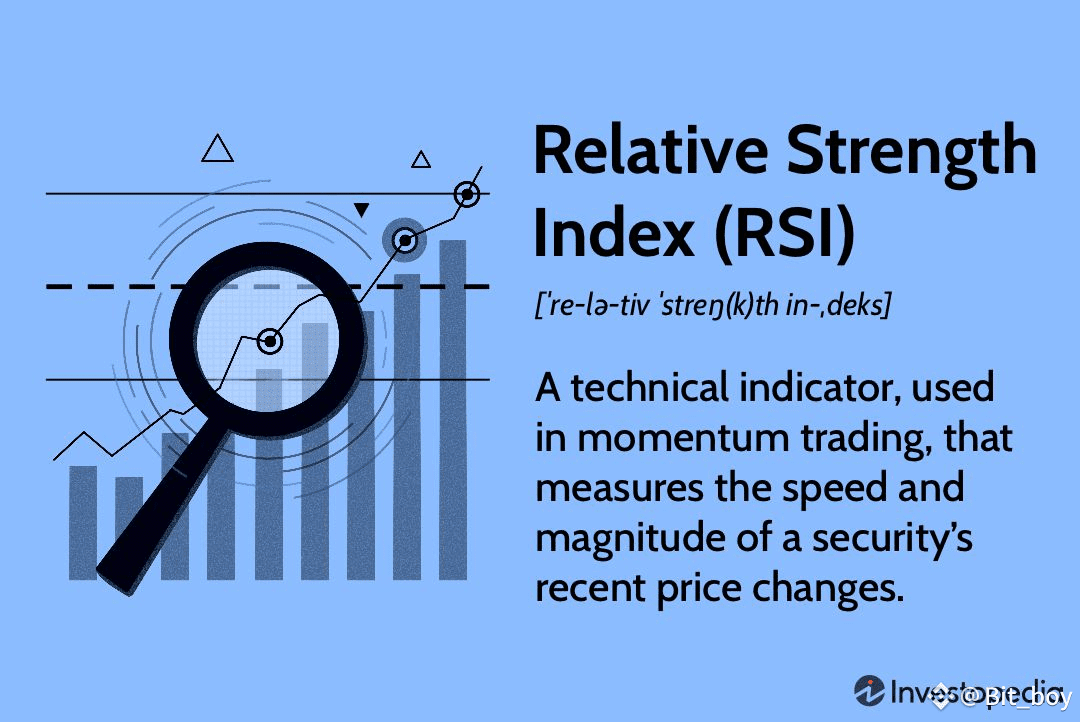
3/ ➮
Moving Averages smooth price and show overall trend
EMA reacts faster than SMA, ideal for short-term analysis
Golden Cross = SMA 50 crossing above SMA 200 = bullish
Death Cross = SMA 50 below SMA 200 = bearish
I monitor MA alignment across multiple timeframes for trend confirmation.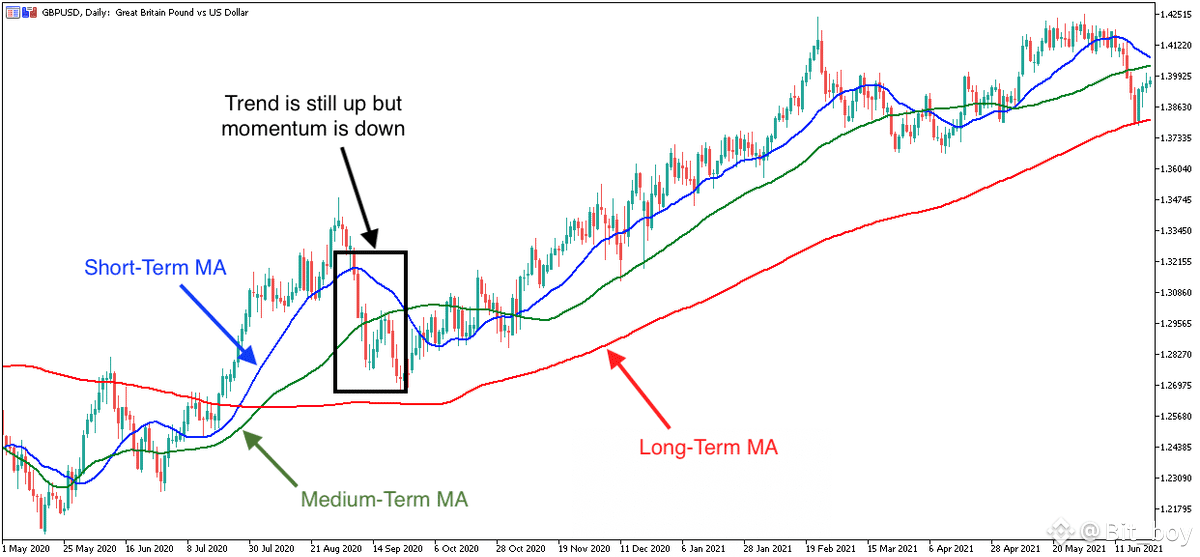
4/ ➮
MACD shows trend direction and momentum strength
When MACD line crosses above Signal line = bullish
When it crosses below = bearish
I track MACD on 4H and 1D charts for trend confirmation
Best use is to confirm entry/exit alongside structure and volume. 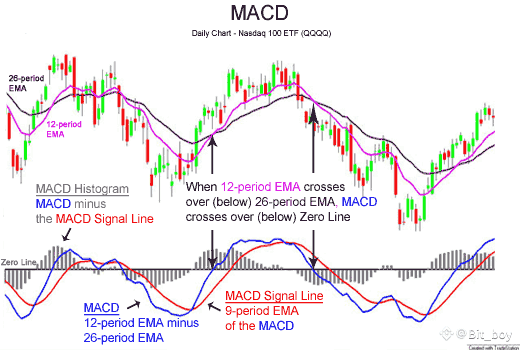
5/ ➮
VWAP shows average price weighted by volume, key for intraday traders
Price above VWAP = bullish bias
Price below VWAP = bearish bias
Institutions use VWAP to enter and exit without moving markets
I use it as dynamic support/resistance for high-probability setups. 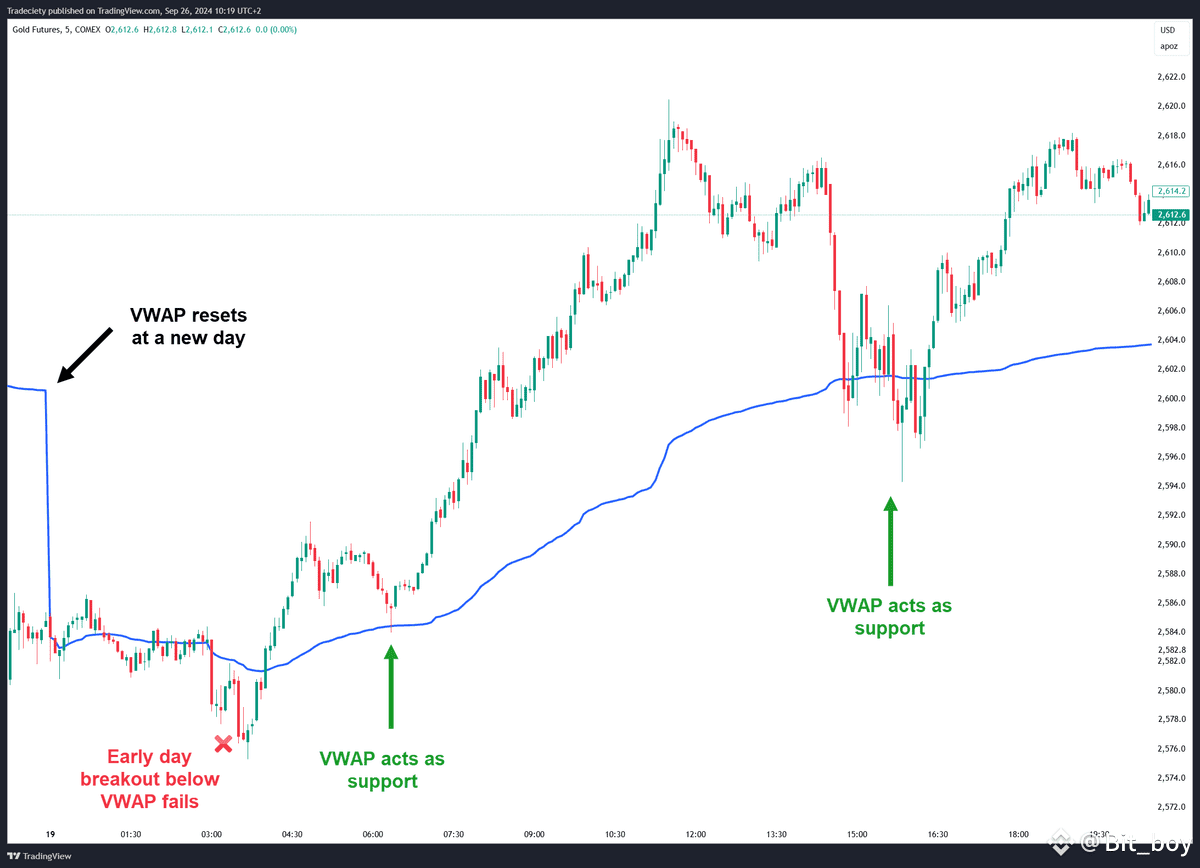
6/ ➮
Fibonacci Retracement levels identify key support during pullbacks
0.382 and 0.618 are most useful retracement levels
I draw Fibs from swing low to swing high in an uptrend
When price pulls back to a Fib level + holds = entry opportunity
Always look for volume confirmation before acting on Fib zones. 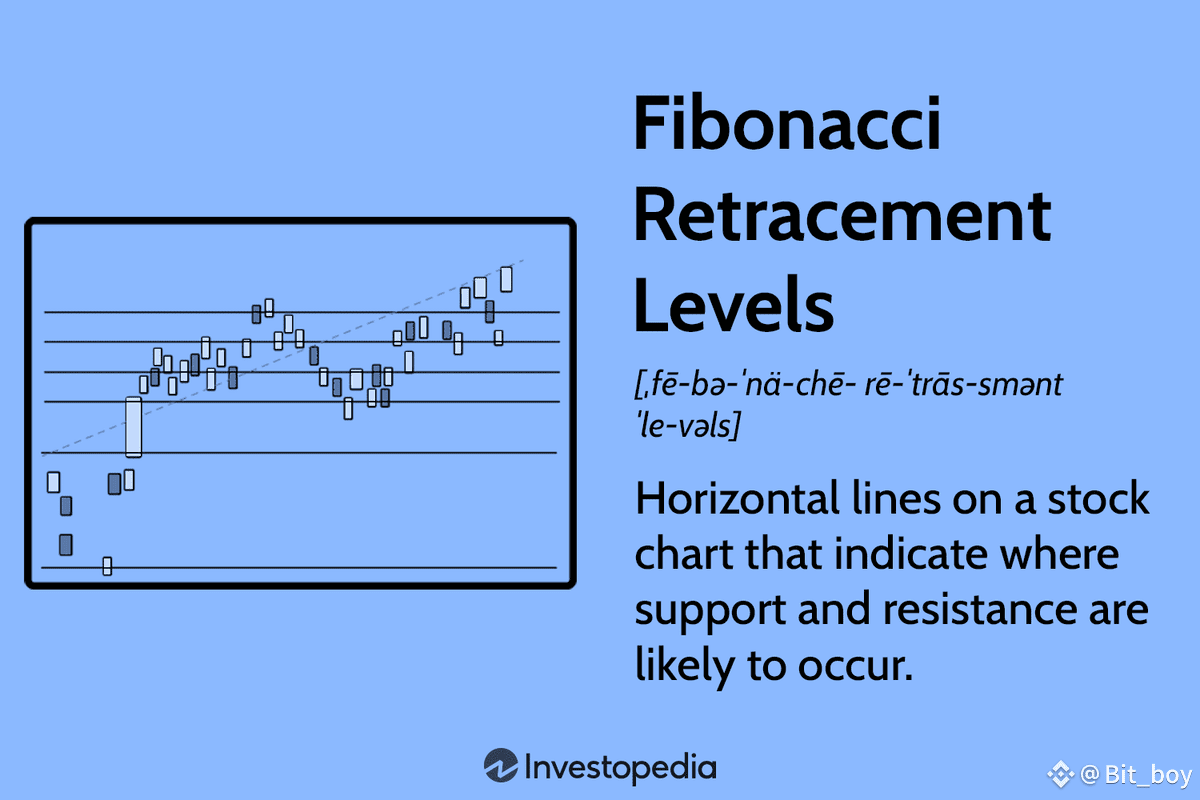
7/ ➮
Support and Resistance show where price historically reacts
Support = level where buying pressure absorbs selling
Resistance = level where sellers cap price advances
Break and retest of resistance turning into support = bullish
I trade S/R only with volume and clean structure confirmation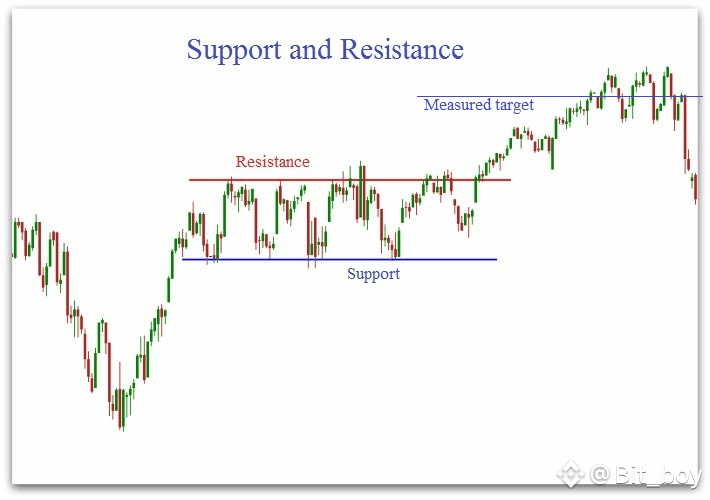
8/ ➮
Fear & Greed Index shows sentiment extremes
Scale from 0 (fear) to 100 (greed)
Low values suggest capitulation, potential bottom zones
High values suggest euphoria, potential top zones
I monitor this index as macro sentiment context for positioning. 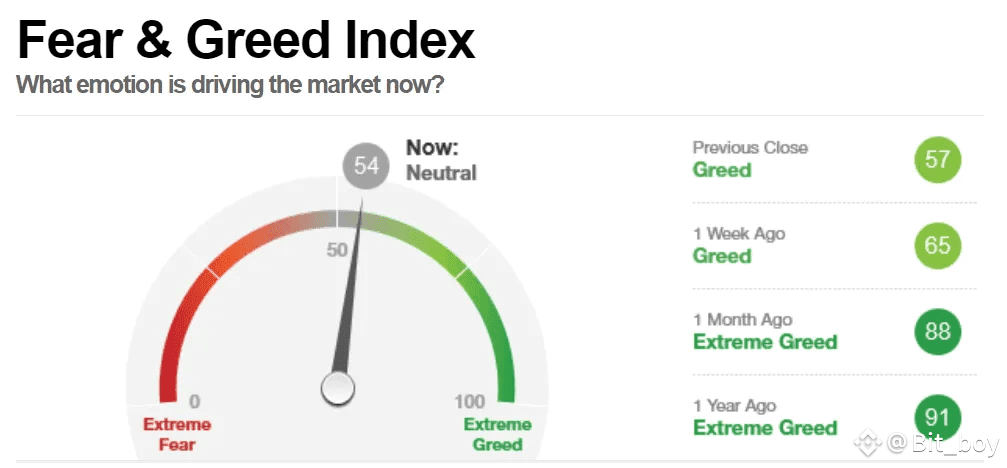
9/ ➮
Accumulation Zones = areas where smart money loads up before breakouts
Defined by tight price ranges after large dumps
Volume often stays steady or rises quietly during this phase
I buy near support inside accumulation zones when whales enter
Watch for breakout + volume spike as confirmation. 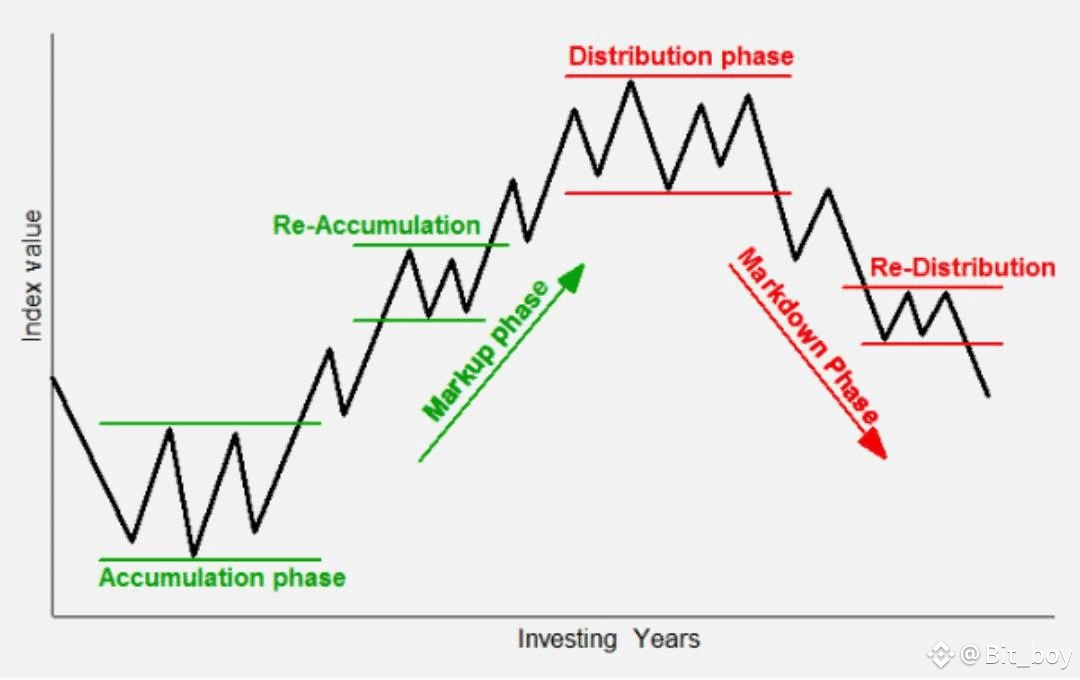
10/ ➮
ATH breakouts = entry into price discovery where no supply overhead exists
Strong setups show higher lows into the ATH resistance
I enter either pre-breakout or on retest of the former ATH as support
Fibonacci extensions help target upside after breakout
ATH breakouts can run far if clean orderbook and strong demand
11/ ➮
EMA 200 on 4H and 1D = one of the strongest trend indicators
Price above EMA 200 = uptrend
Price below EMA 200 = downtrend
I use EMA 200 as dynamic support or resistance for trend trades
Combine with RSI or VWAP for higher conviction setups
12/ ➮
These indicators give structure to your analysis and remove guesswork
Master them and you won’t depend on random calls or narratives
Combine trend, momentum, and sentiment indicators for best results
Focus on execution - the tools work if you know how to use them properly.
