🔍 Market Pulse
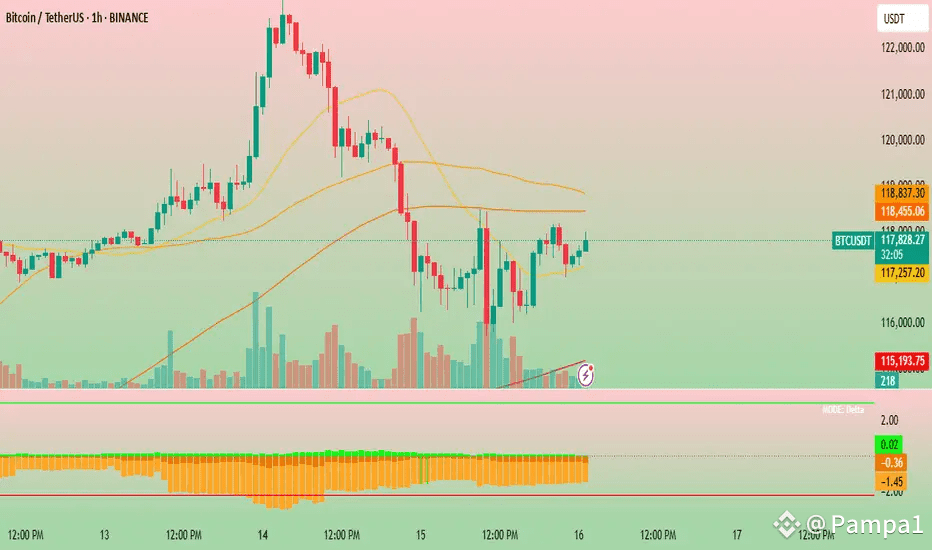
Pair: $BTC / USDT
Key Insight: Volume Spread Analysis (VSA) signals rising selling pressure—wider spreads on down‑moves with heavy volume means sellers are dominating the market .
---
📊 Why This Matters
1. Supply Dominance: Recent down candles on high volume suggest institutional or smart-money selling momentum .
2. Weak Demand: Few strong rallies to balance sellers—buyers are not stepping in quickly .
3. Redistribution Zone: Price action around the $108K–112K range may be a redistribution zone, meaning sellers are unloading before potential further drop .
---
🛠️ Volume Spread Analysis: Key Takeaways
Climactic Volume: Big-volume bearish bars show supply dominance; look for tapering volume on future down bars—could signal a short-term bounce .
Spread + Volume: Wide red candles with heavy volume often run through stop-loss points or liquidity levels below key support (~91–93k) .
Watch the Gaps: Fair Value Gaps around 93,100–93,800 and 95,000–96,000 mark key zones—retracements here could be prime entry points for short positions .
---
🎯 Possible Scenarios & Strategy
Scenario What to Watch Action
🔻 Bearish Continuation Price dips below ~91,133 + solid volume → next target ~90,627 or lower Consider short entries after retracement into 93–94k zone; SL above gap (~95k)
🟢 Bullish Reversal Price breaks above ~93,800–95,000 on high volume → buyers re-enter Watch for retest & confirmation—possible long entry for bounce toward ~96k+
---
💡 Pro Tips
Use VSA to spot supply/demand shifts—wide spreads on heavy volume = sell signal.
Track down-volume volume: decreasing signals exhaustion; steady or rising suggests more downside.
Combine with RSI or EMAs to confirm oversold levels or trend weakness.
Trade with defined R:R ratios & set your stop losses just above/under key levels—avoid chasing without confirmation.
---
🔁 What About the Bulls?
Despite VSA showing bearish flow, many analysts still point to BTC holding in the $98k–117k range as an accumulation zone . If BTC maintains above critical supports (~105k), a turnaround into bullish momentum could be on the horizon.
---
🚀 Final Word
VSA shows sellers are active—but keep an eye on volume trends for clues of exhaustion. 🧠
If BTC breaks below 91k with strong volume, bearish continuation is likely.
If BTC climbs above 94–95k on strength, reversal may begin.
What’s your take—are you leaning shorting the bounce or waiting for a bull reversal? Drop a 🔥 if you’re prepping your setup! Let’s discuss and sharpen our edge together 💬
---
