After re-establishing the $3,000 mark for the first time since February 1, Ether (ETH) is showing superior strength compared to Bitcoin (BTC). While BTC slipped to $116,500 on Tuesday, ETH recorded a steady increase during the day, setting a new weekly high at $3,090.
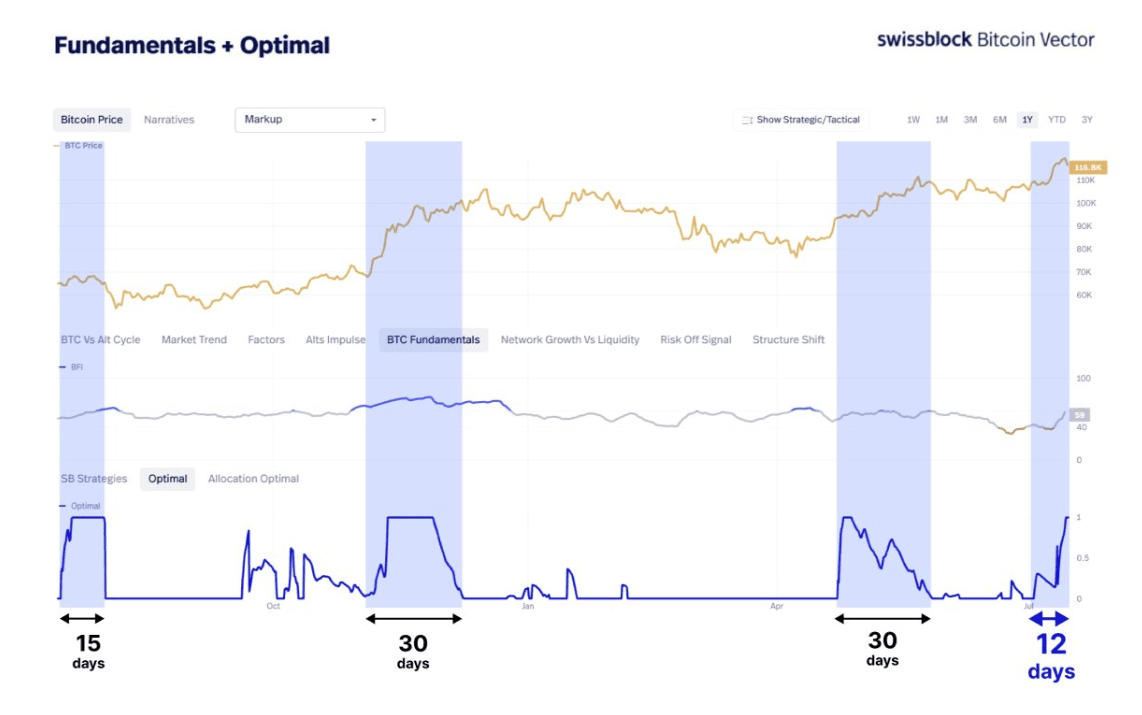
One of the potential factors driving ETH's increase is the capital flow showing signs of shifting from Bitcoin to altcoins. According to analytics company Swissblock, in the previous four bull cycles, each Bitcoin price surge typically lasted from 15 to 30 days. The current surge has entered its 12th day, indicating that profit-taking pressure may be increasing – thus triggering a wave of capital shifting to alternative assets like ETH.
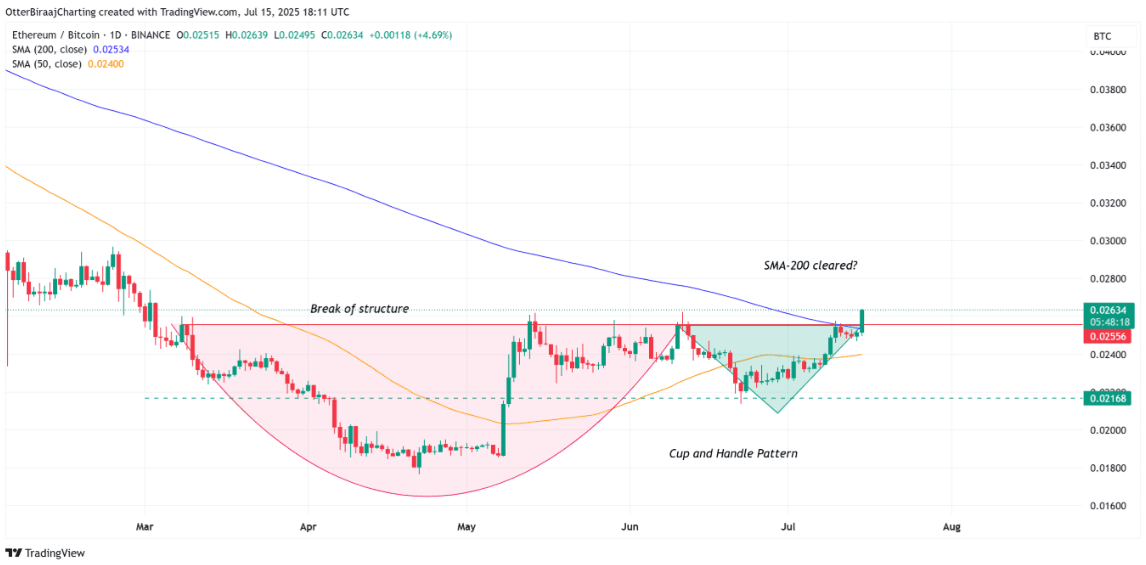
This trend is clearly reflected in the ETH/BTC trading pair. On the daily chart, ETH/BTC has just recorded a breakout above the accumulation structure – the first time since May 24 – indicating a potential trend reversal is forming. Notably, this pair has also surpassed the 200-day moving average for the first time in a year – a strong signal reinforcing the positive outlook for Ether in the medium and long term.
Supporting the bullish outlook for Ether, analyst Ted Pillows highlights that the Relative Strength Index (RSI) on the weekly chart for the ETH/BTC pair has just broken a downward trend that has lasted for three years — an important technical sign indicating a strong recovery is forming. Not only that, a 'golden cross' is also beginning to emerge, further reinforcing the possibility of a trend structure reversal.
At the same time, Bitcoin's dominance ratio is showing signs of weakening – something often seen as a signal for the start of 'altcoin season'. In this context, Ether may lead the growth wave in the coming weeks, as the market shifts its attention away from Bitcoin and towards promising altcoin assets.
Can Ether increase by 1,110% in this cycle?
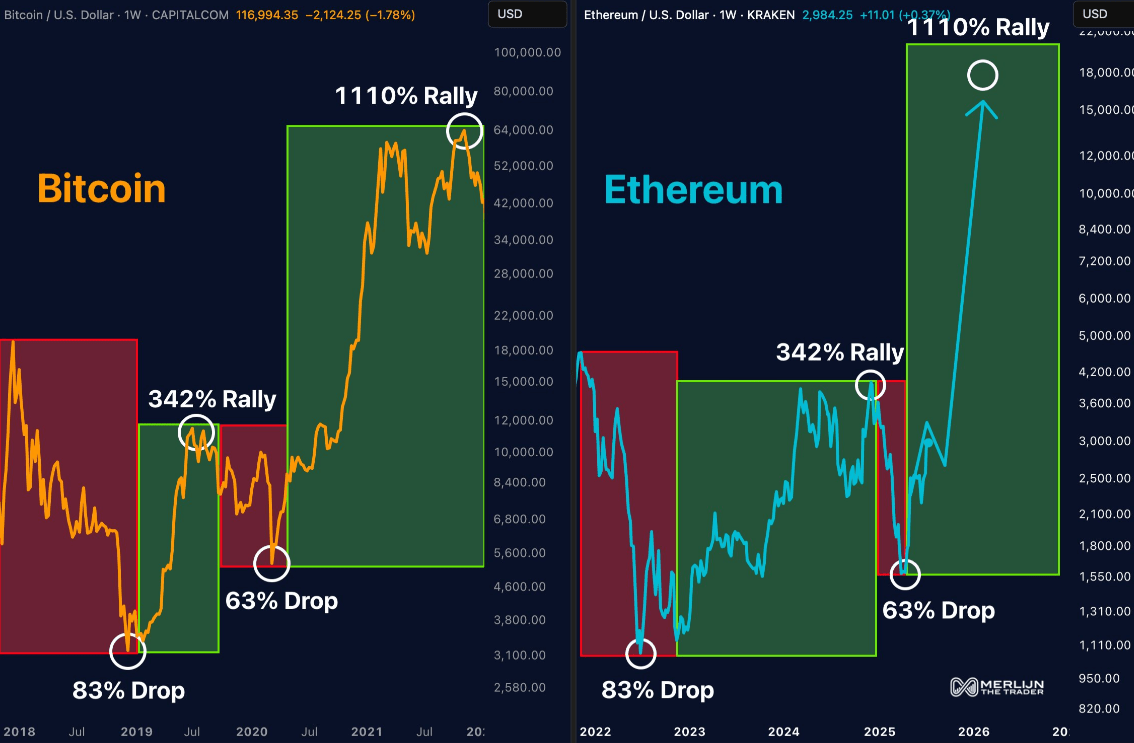
Cryptocurrency analyst Merlijn The Trader recently shared an impressive fractal analysis, showing that Ether (ETH) may be repeating Bitcoin's growth trajectory in the 2018–2021 cycle. According to this model, the recovery from the $1,550 low in April could open up a 'vertical growth phase' with a margin of up to 1,110%, bringing the price of ETH to the $18,205 range.
A highlight in the analysis is the adjustment pattern of 63% before a sharp increase of 342% — a scenario that previously occurred with Bitcoin in the last growth cycle. Notably, ETH has recorded an increase of over 100% since Q2, further bolstering confidence in a breakout scenario according to the fractal model.
However, while the fractal chart provides a visually compelling perspective, this method remains highly speculative. So far, fractals have not been validated through experimental studies or rigorous academic evaluations, and interpreting the model heavily relies on personal viewpoints. Nevertheless, the similarities in historical price behavior are fueling hope for the investor community to believe in ETH's long-term growth trend.
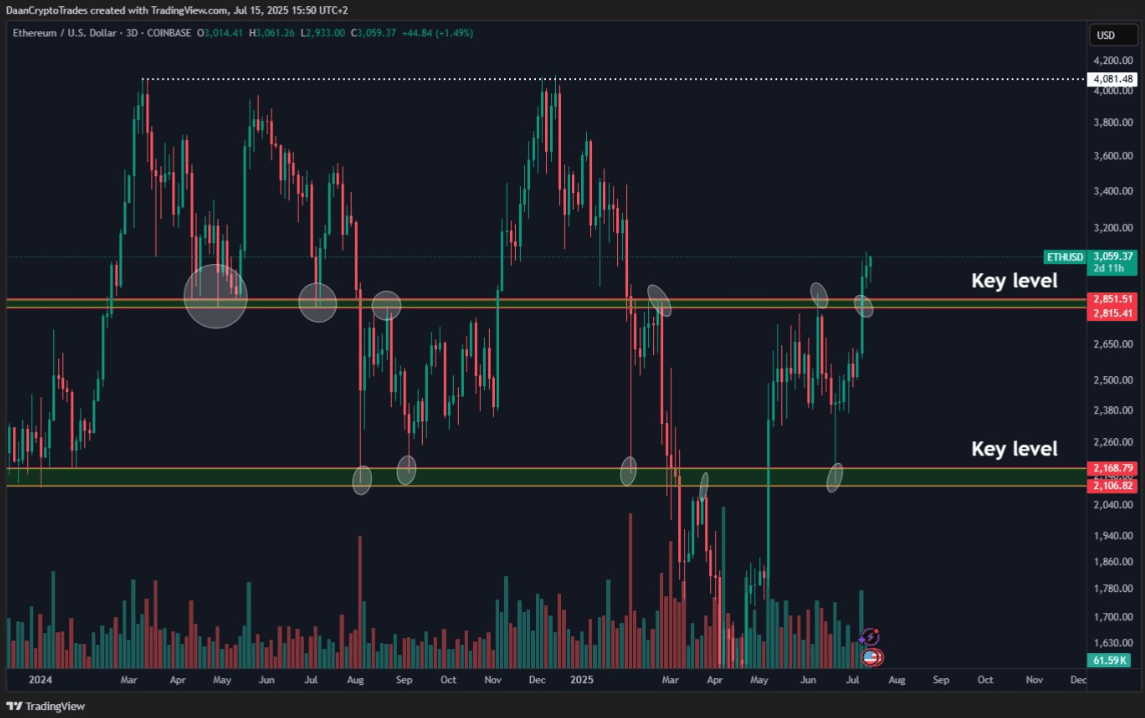
From a technical perspective, analyst Daan Crypto notes that the $4,000 mark is Ethereum's next target after the coin officially broke into the upper half of the accumulation range that has lasted for 18 months.
On the X platform, this trader emphasizes:
"ETH has entered the upper half of the larger cycle range. On the long-term timeframe, there are only two price points truly worth noting: $2,800 and $4,000. The rest is just noise not worth worrying about."