Bitcoin (BTC) has retraced after setting a new historical high at $123,218 on Monday, indicating that profit-taking has begun to appear at high price levels. However, this move seems to be purely technical, as fundamental investment demand remains very strong. According to data from BitcoinTreasuries.NET, companies holding Bitcoin have accumulated a total of 159,107 BTC in Q2 – a figure that shows long-term confidence from institutions in this asset.
Not only the 'big players', but also the group of retail investors are actively participating. A Monday market report from Bitfinex reveals that individual investor groups – including 'Shrimp' (<1 BTC), 'Crab' (1–10 BTC), and 'Fish' (10–100 BTC) – are purchasing about 19,300 BTC each month. Notably, this figure far exceeds the new BTC supply released each month (around 13,400 BTC) since the halving event in April 2024.
With overwhelming demand coming from both institutions and individuals, does BTC have enough momentum to conquer the $150,000 mark? Let's analyze the technical chart to find the answer.
Technical analysis of BTC
Bitcoin is currently undergoing a correction, likely pulling the price back to the neckline of the inverted head and shoulders pattern, near the $113,000 area.
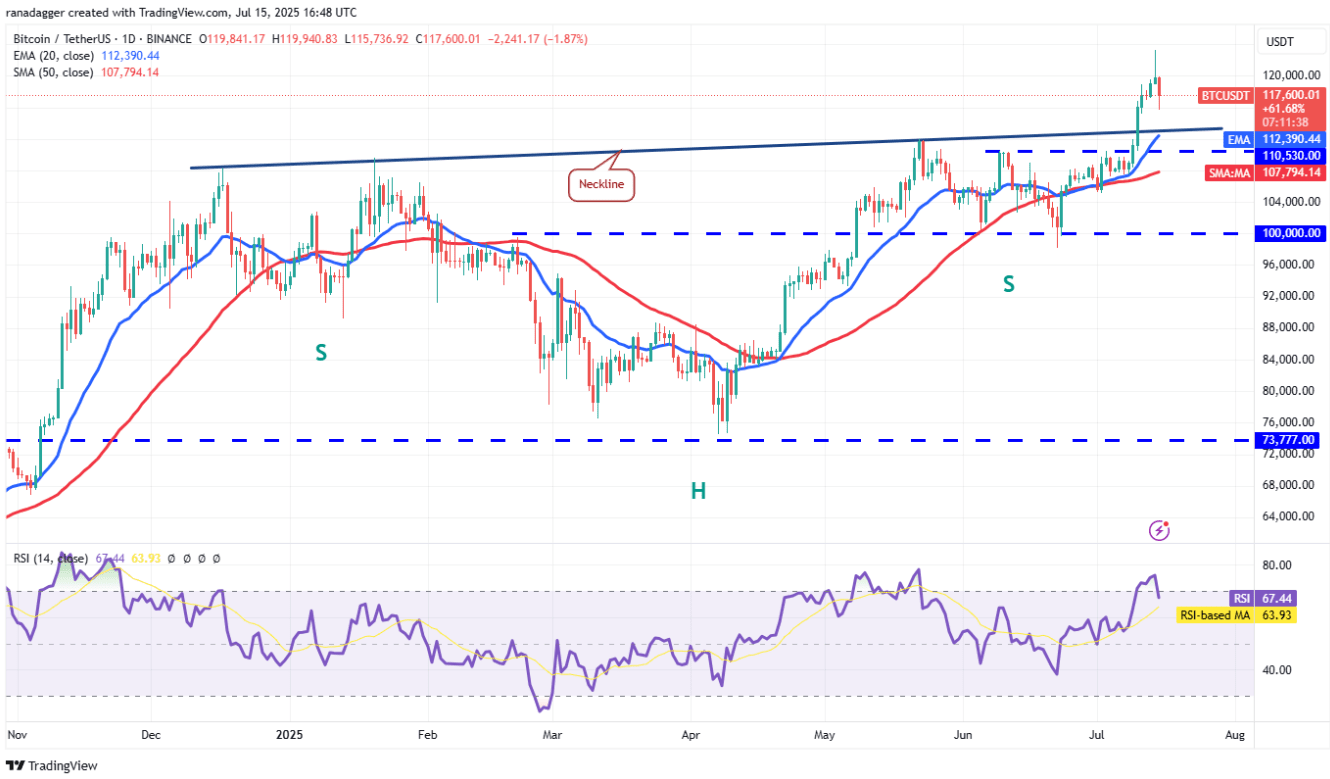
The 20-day exponential moving average (EMA) is trending upwards ($112,390) along with the relative strength index (RSI) oscillating near the overbought zone, indicating that the advantage remains with the bulls. If the price bounces back from the 20-day EMA, the bulls will attempt to push the BTC/USDT pair above the $123,218 level. If successful, the price could continue to rise towards the model target of $150,000.
Conversely, if the price breaks and closes below the 20-day EMA, it would signal that the upward momentum is weakening, potentially delaying the next uptrend. In this case, BTC could drop to the 50-day simple moving average (SMA) at $107,794.
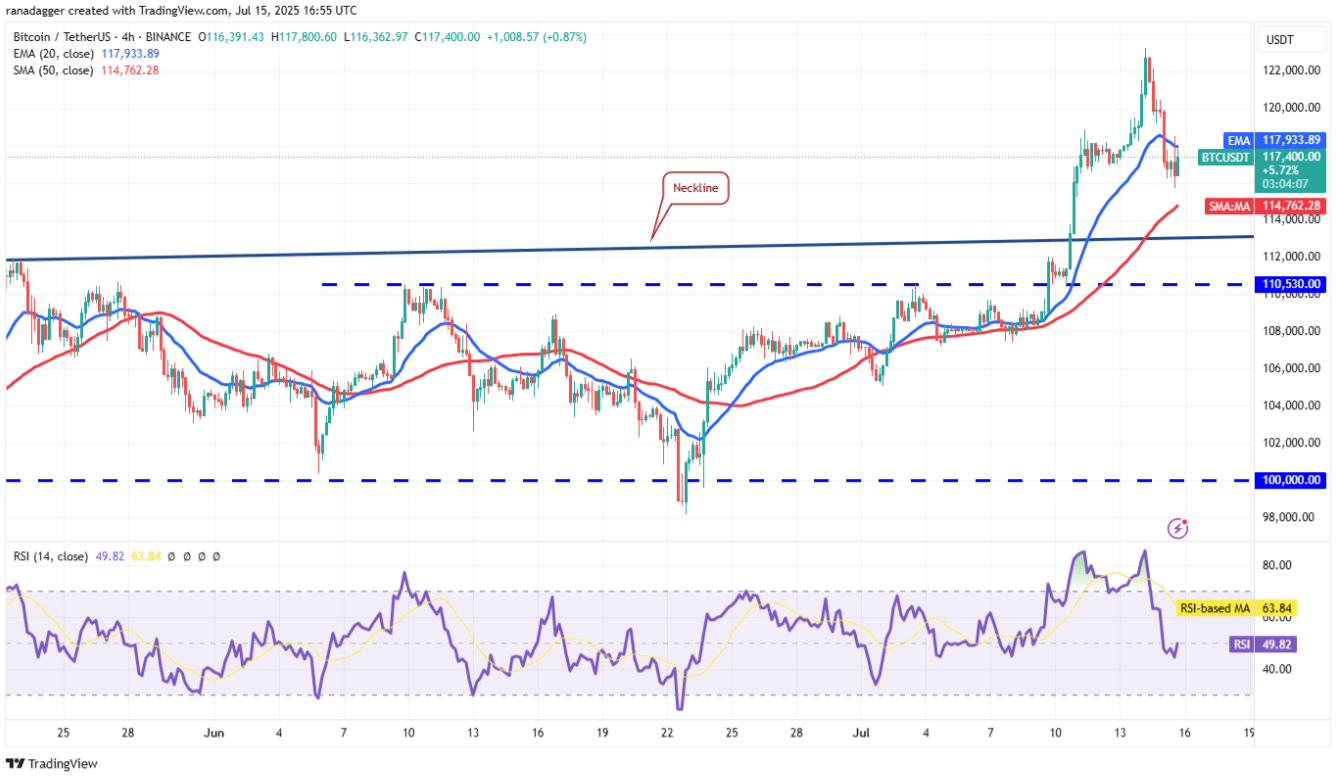
On the 4-hour chart, the BTC/USDT pair has broken through the 20-period EMA, indicating a short-term weakening signal. The bulls are currently trying to create a rebound, but are likely to encounter selling pressure at the 20-period EMA. If the price turns down from this EMA and breaks below the $115,000 mark, it could drop to the neckline.
The bulls are expected to actively defend the support area from the neckline to the $110,530 level. If the price bounces back from this zone and rises above the 20-day EMA, it would be a sign that the bulls are returning. In that case, BTC could once again target the $123,218 mark.
However, this positive scenario would be invalidated in the short term if the price breaks below the $110,530 level. In that case, BTC could fall to $108,000, or even $105,000. The deeper the correction, the longer the time required for recovery and continuation of the uptrend.