
Dogecoin is showing signs of breaking out after reclaiming the $0.20-0.21 price range before a slight pullback. Analysts are closely monitoring the $0.21329 level, as a weekly close above this could pave the way for prices of $0.25, $0.33, and even $0.48.
Dogecoin Breaks Resistance Level
Analyst Ali Martinez emphasizes that Dogecoin's price has recovered and is holding near $0.20–$0.21, signaling a potential breakout. He notes that the next resistance level is $0.22.
On his chart, there is a clear breakout of the bullish structure on the daily chart. The leading meme coin's price has been making higher lows since the end of June. This indicates an accumulation process is occurring beneath the resistance level.
According to his prediction, if Dogecoin's price maintains this structure, the upward momentum could extend to $0.25. The dotted line on the chart also indicates the possibility of rising higher to $0.26 after testing the $0.24 resistance level.
If DOGE's bullish momentum continues, the $0.25 area could serve as a stepping stone for the next breakout. A weekly close above $0.21329 would also turn this area into support.
DOGE Weekly Breakout Above $0.213
Another analyst, Bitcoinsensus, described the major breakout as $0.21329 on the weekly chart. For DOGE's price to continue the uptrend, analysts agree that a weekly candle must close above this level.
Their chart indicates a clear breakout to the next targets of $0.34177 and $0.48642.
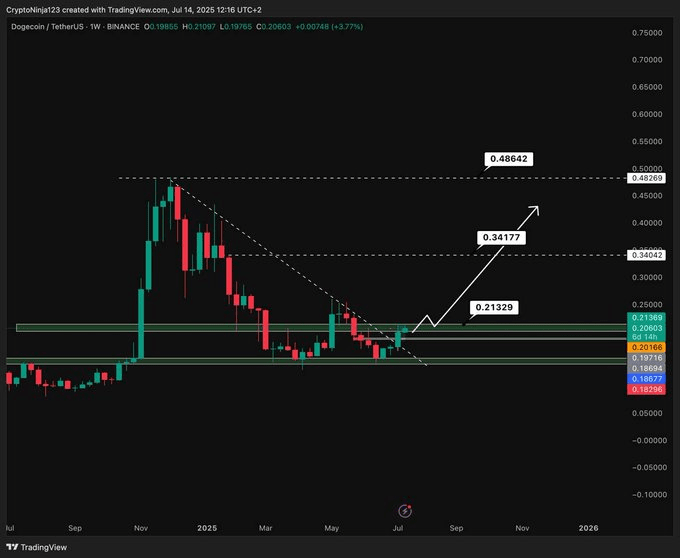
The analysis includes a breakout from a descending resistance trendline, which has held Dogecoin's price in a downtrend since March. The meme coin has since moved above that trendline, and recent consolidation is occurring at that resistance point.
If the weekly close is above $0.21329, this would confirm a bullish reversal structure. In that case, DOGE's price could surge to $0.34 in the next bullish wave, with a long-term target of $0.48.
However, if the meme coin's price is rejected, analysts predict support will be in the range of $0.182 to $0.186.
The Double Bottom Pattern Could Push DOGE to $0.33
Hailey LUNC has added momentum to the optimism. She has identified a valid double bottom pattern on the daily chart.
Based on her post, the neckline is $0.24. If the leading memecoin breaks this neckline, it could quickly rise to $0.33 in a confirmed bullish move.
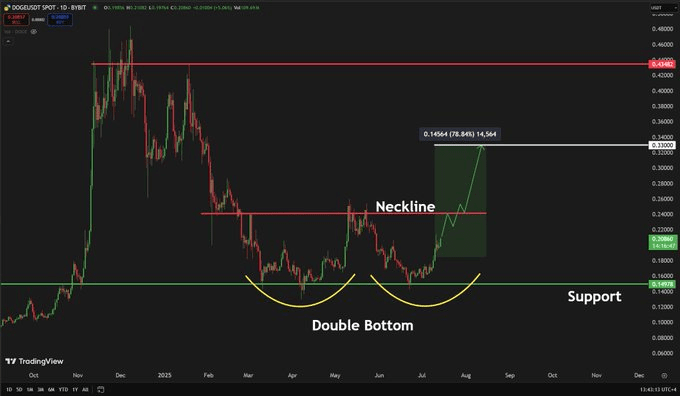
Her chart outlines a complete double bottom, with strong support near the $0.14–$0.16 level. Dogecoin's price is currently returning to test the neckline, creating upward pressure.
If buyers push above the $0.24 threshold, this move could yield a 35% increase. Hailey notes that Bitcoin's strength continues to propel the altcoin sector.
Dogecoin, often seen as a sentiment driver, is responding accordingly. This structure reflects historical price spikes, where DOGE's price surged after retesting key resistance levels.
Historical Wedge Pattern Repeating for 2025
Trader Tardigrade has provided a longer-term perspective by comparing effective chart patterns. He notes that DOGE's price is repeating the descending expanding wedge pattern from 2024.
The two-week chart shows a nearly identical wave structure. This suggests that if historical movements continue, we could witness a parabolic move.
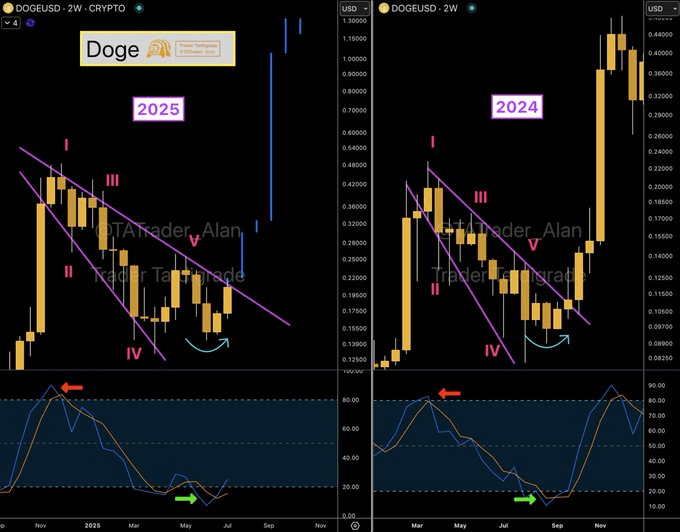
The wedge pattern consists of five descending waves with a breakout at wave V. A similar scenario occurred in 2024, leading to a multi-month bullish rally.
If the 2025 version is confirmed, Dogecoin's price could return to the range of $0.70 to $1.00. Meanwhile, momentum indicators support the likelihood of a breakout.
The stochastic RSI indicator is emerging from oversold levels, similar to what occurred in 2024. Such a crossover is a bullish divergence and confirms the formation of a base. $XRP
