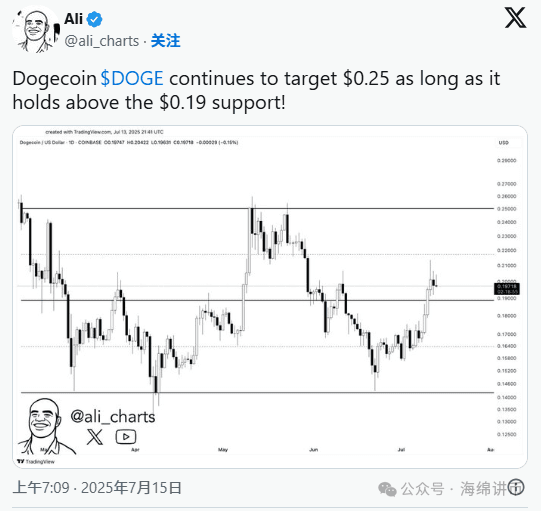
Dogecoin (DOGE) is trading above the support level of $0.19 and forming higher lows, with $0.25 becoming the next potential target.
Dogecoin has reclaimed $0.19 as support, forming higher lows, targeting a push towards $0.25.
Analysts emphasize that $0.213 is the breakout level for DOGE to maintain upward momentum.
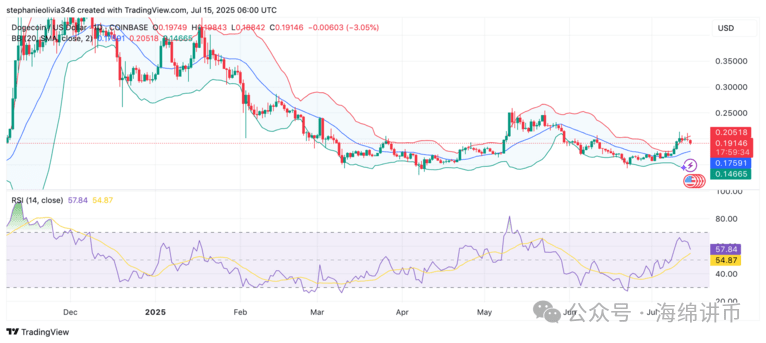
RSI remains neutral, while the Bollinger Bands and volume indicate that there is room for further price fluctuations.
Dogecoin is holding at $0.19.
Dogecoin (DOGE) has gained new support at the $0.19 level and is currently trading slightly below $0.20. Over the past week, Dogecoin's price has risen by 14%, but it has dropped about 8% in the last 24 hours.
It is worth noting that the rebound from $0.19 is seen as a significant structural change, bringing the $0.25 range back into focus.
Dogecoin recently broke through the $0.19 area, which had been a resistance level in May and early June. This trend currently confirms that this level will become new support. The daily chart shows the price rebounding from the visible trading channel's low, forming a new upward trend in short-term lows.
Analyst Ali points out that as long as Dogecoin can maintain this recovery level, it may continue to target $0.25. A significant increase in trading volume could push the price up to the upper limit of this range. If momentum weakens, falling below $0.19 would break the current pattern.
Focus on the weekly resistance level of $0.213.
Another key area is at $0.213. Analysts state that a breakout and close above this weekly line is needed for the current trend to continue. If this occurs, traders may focus on higher regions such as $0.34 and $0.48.
If it fails to break above $0.213, it may lead to a pullback to the $0.186-$0.182 range. Before this, the market remains in a short-term upward structure, with key levels clearly visible.
Momentum indicators and user activity.
The Bollinger Bands show that Dogecoin's price is near the upper band, suggesting increased volatility and upward pressure. The price is still trading above the 20-day simple moving average, which acts as a local support level.
The RSI on the daily chart is around 58, indicating a neutral level. If demand rebounds, this could provide room for further upward movement, but a decrease in momentum may lead to a pause in the short term.
Data from Glassnode shows that as of July 14, there are 68,268 active DOGE addresses. This surge in activity often occurs after significant price fluctuations, but overall, they are not as high as in earlier market cycles.
