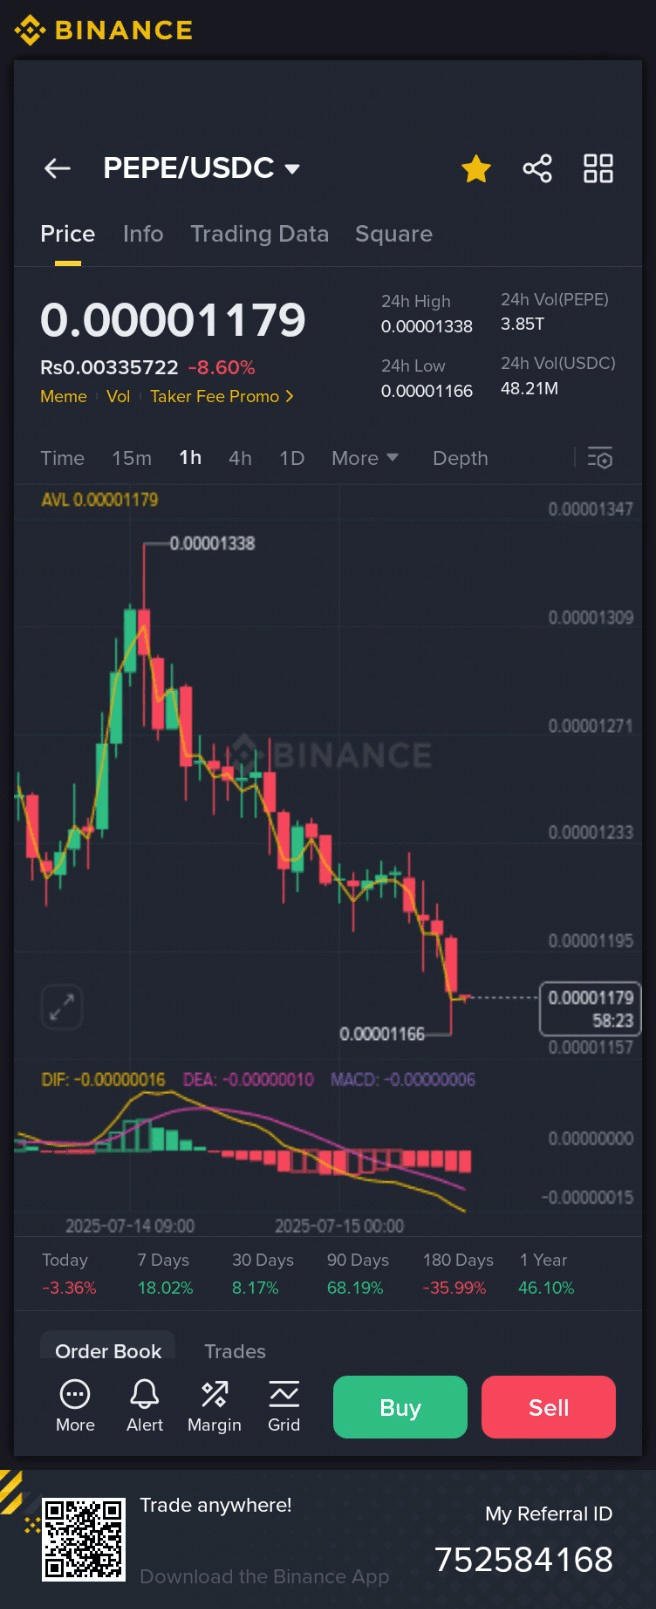
This image is of the PEPE/USDC trading chart on Binance and it shows the market situation as per the 1 hour timeframe. Let's do a complete analysis of it in Urdu:
📉 Current market situation:
Price: 0.00001179 USDC
Change: -8.60% decrease (Today's decrease shows that the market is under pressure)
24-hour high: 0.00001338
24-hour low: 0.00001166
📊 Chart Analysis (1 hour):
The chart clearly shows that:
The market is continuously moving downwards (downtrend).
The candles are consistently red, indicating selling pressure.
A support level is visible at 0.00001166, but it is also at risk.
💹 MACD and DIF indicators:
MACD, DIF and DEA are all in the negative:
DIF: -0.00000016
DEA: -0.00000010
MACD: -0.00000006
All of this shows that the market is likely to decline further and there is no bullish signal yet.
📅 Performance on time frames:
DurationPercentage ChangeToday-3.36% 🔻7 days+18.02% 🔼30 days+8.17% 🔼90 days+68.19% 🔼180 days-35.99% 🔻1 year+46.10% 🔼
This data shows that although PEPE has made gains in the past few days and months, the market has weakened at this time.
📌 Conclusion and advice (Analysis Summary):
The market is on the downside right now.
Selling pressure is high in the short term (1 hour/day).
The support level is around 0.00001166 — if it breaks, further declines are possible.
Traders should be cautious.
If you are a long-term holder, it would be better to enter at lower levels.