
This chart is a 1-hour candlestick chart for Bitcoin/US Dollar (BTC/USD) from Binance, analyzed using TradingView. Here's a breakdown of the technical elements:
---
🔍 Key Observations:
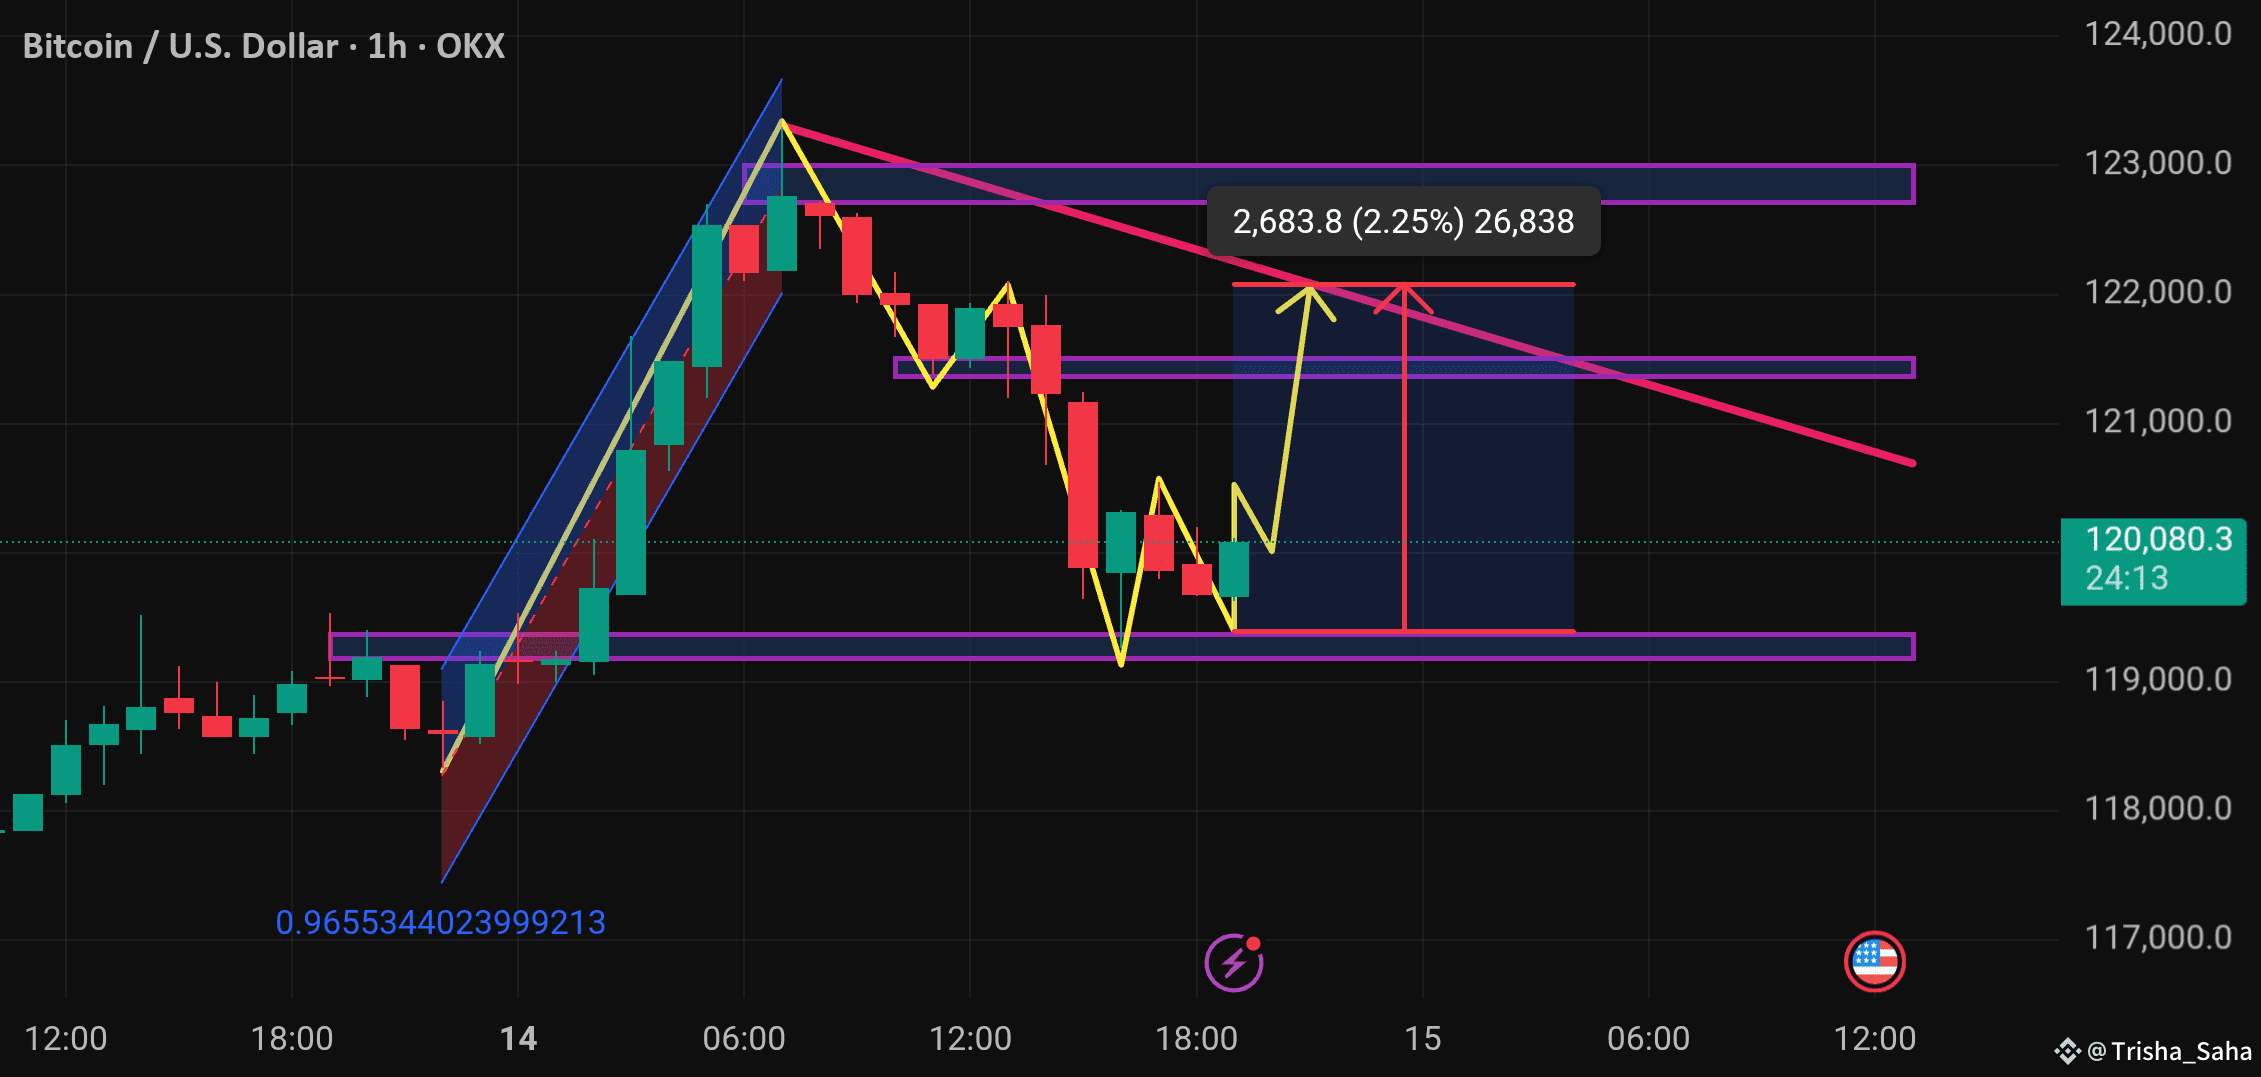
1. Current Price
$120,054.6 with a +0.77% gain.
Price appears to be rebounding from recent support.
2. Chart Patterns & Annotations
Yellow Zigzag Lines: Indicate recent price action and a potential bullish reversal pattern forming.
Purple Zones: Likely represent key support and resistance levels.
Pink Downtrend Line: A descending trendline showing the bearish resistance.
Blue Box Area: Suggests a potential price movement range—either up or down.
---
📈 Technical Analysis Insights
✅ Bullish Case (Upside Scenario)
Break above descending trendline could lead BTC to:
Target: ~122,800 - 123,000
Potential
#BTC120kVs125kToday #USCryptoWeek #MemecoinSentiment #StrategyBTCPurchase #ETHBreaks3k