📊 Detailed technical analysis of the image
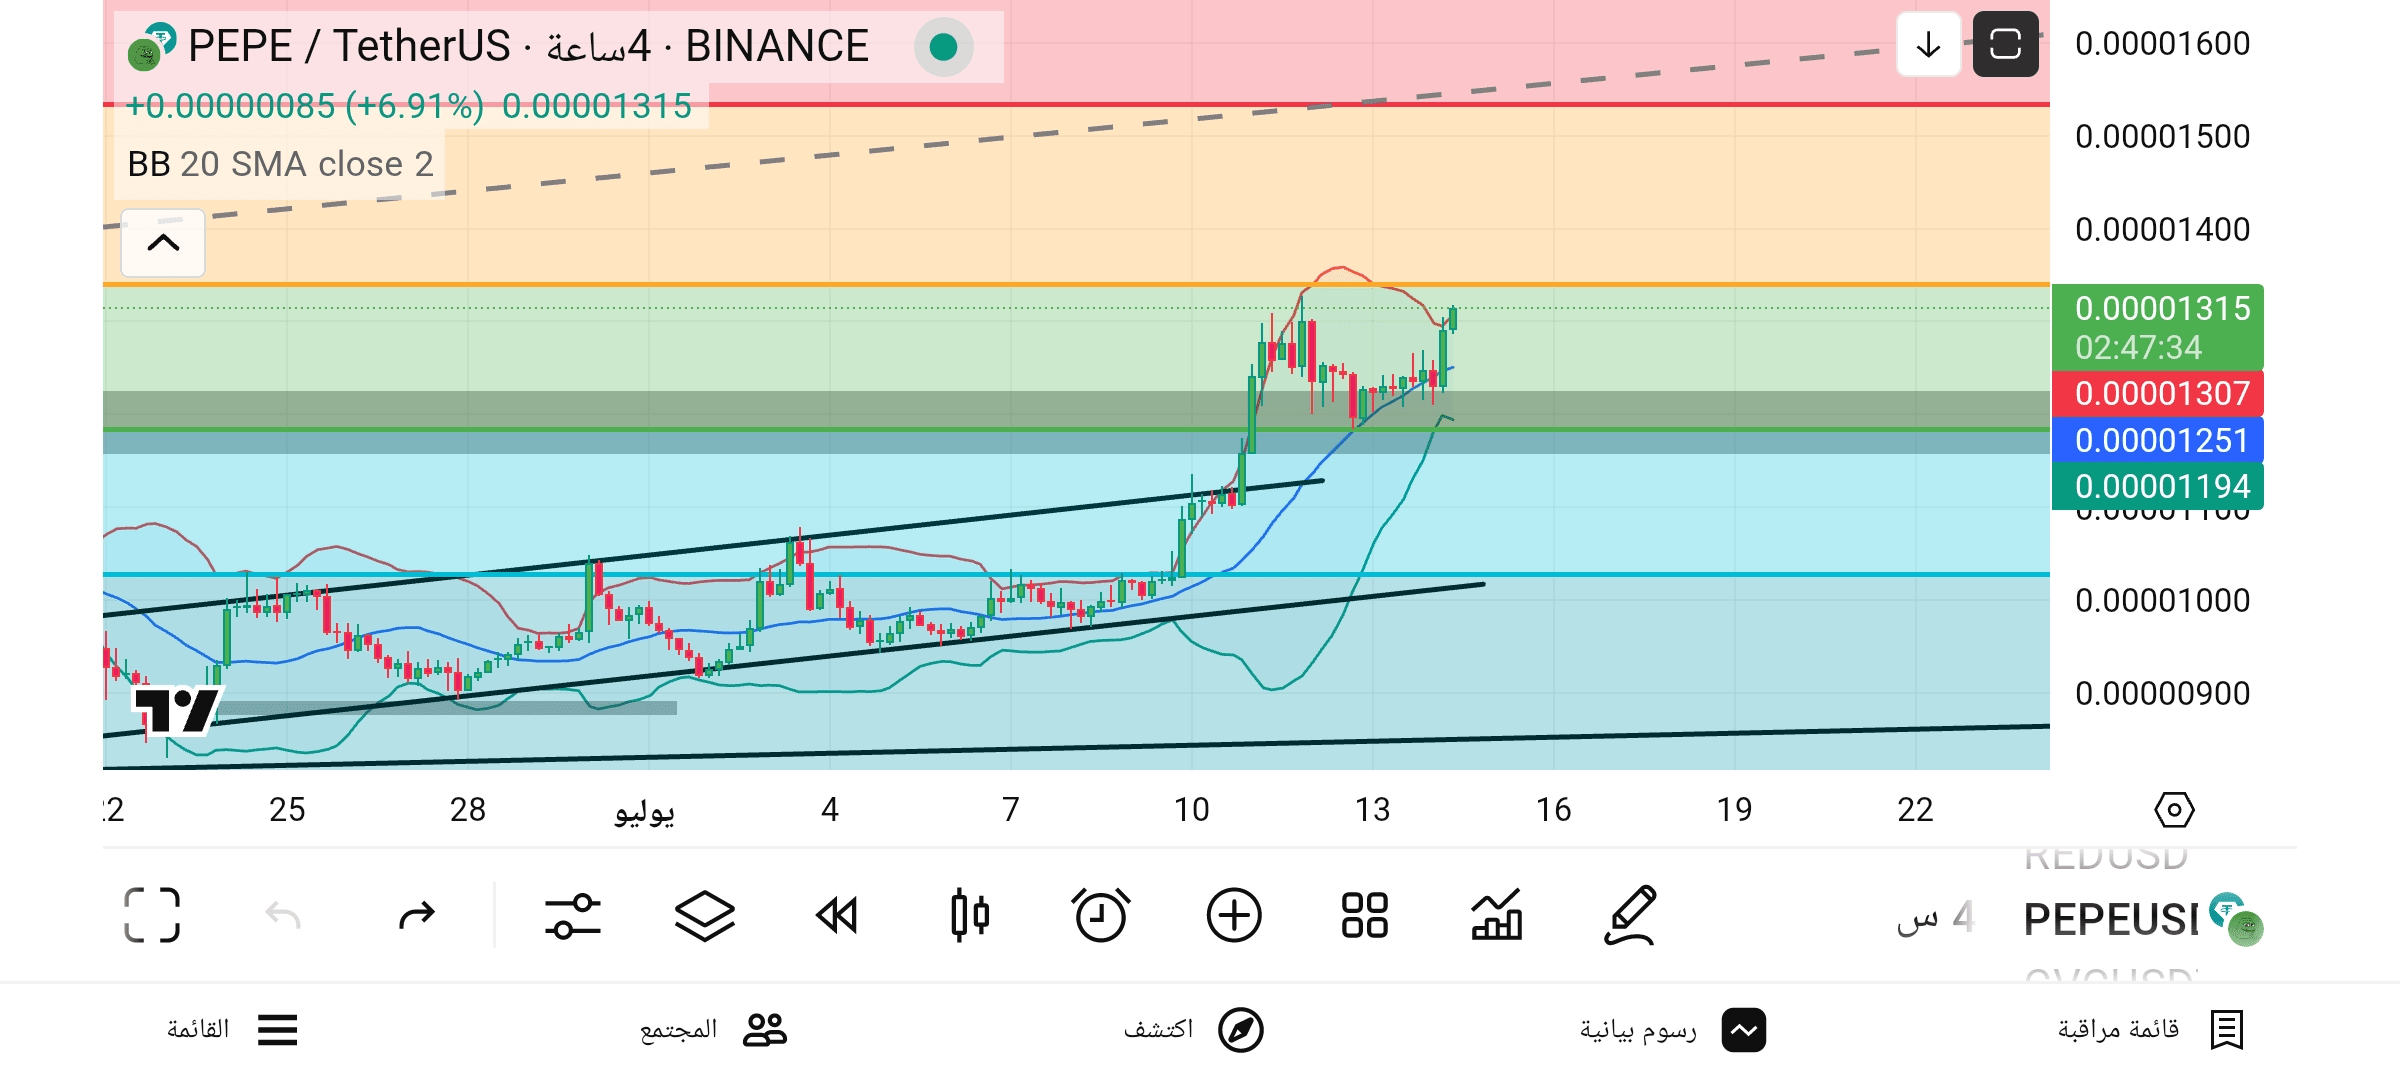
✅ Time frame: 4 hours
✅ Current price: 0.00001315 (screenshot time)
✅ Current percentage: +6.91%
🟢 1. General trend (Trend):
We notice that the price broke through the small upward channel that was extending from June 25 to July 10, which is evidence of accelerating upward movement.
The trend is currently strongly upward with higher highs & higher lows.
🟥 2. Support and resistance areas:
📌 Resistance areas:
0.00001307 - 0.00001315: (current area) represents strong resistance currently, and the price is trying to break through and stabilize above it.
0.00001400: considered the next resistance, if the price breaks the current area with stability.
📌 Support areas:
0.00001251: first support, if the price fails to stabilize above it we may see a correction.
0.00001194: second stronger support, represents a good base for any rebound in case of a drop.
📈 3. Bollinger Band signals:
The price is currently touching the upper limit of the Bollinger Band, which may indicate:
Potential for a temporary correction or a break before continuing the rise.
If the price closes above the Bollinger bands for two candles, we may see a bullish price explosion.
🕯️ 4. Current price structure (Price Action):
Note that the price formed a Bull Flag pattern after a strong rise, and this is usually a signal for the continuation of the upward trend if a breakout occurs upwards (which almost happened in the image).
The recent breakout indicates strong positivity.
🚨 5. Upcoming scenarios:
🔺 Positive scenario (if it breaks 0.00001315):
Upcoming targets:
1. 0.00001400
2. 0.00001500
3. In the medium term 0.00001600 (upper resistance in the image)
🔻 Negative scenario (if it fails to stabilize above 0.00001307):
We might see:
1. A return to test support 0.00001251.
2. Breaking this level may push the price towards 0.00001194.