XRP $XRP price prediction as token reclaims #3 crypto position after explosive 25.8% weekly gain with ProShares launching first XRP futures ETFs July 18.
XRP has reclaimed its position as the third-largest cryptocurrency by market capitalization following an explosive 25.8% weekly surge that pushed the token past $170 billion in market value.
The Ripple-backed token broke through critical resistance at $2.80, decisively outperforming Bitcoin and Ethereum during a week that saw the broader crypto market reach new all-time highs.
XRP ETF: A Big Catalyst for Sustained Momentum
ProShares announced the launch of the first XRP futures ETFs beginning July 18, 2025, marking a big moment for institutional access to XRP.
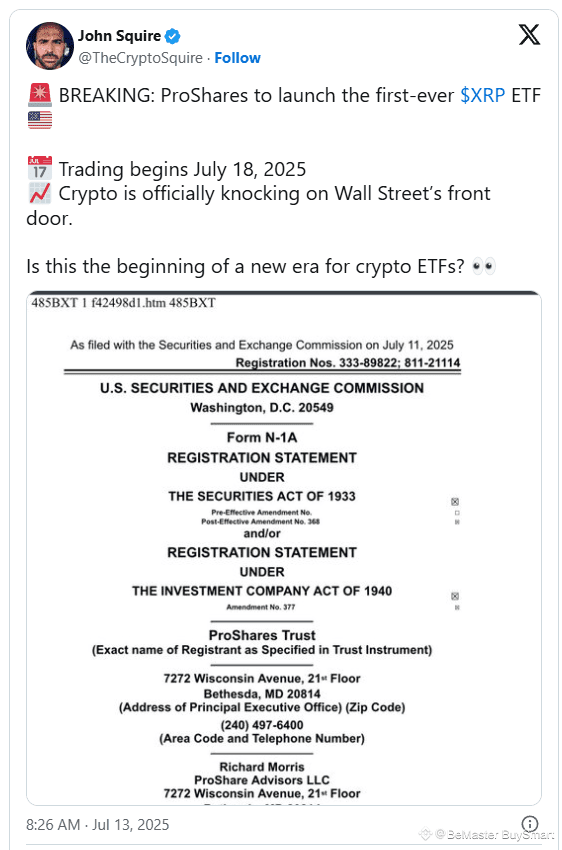
The institutional momentum behind XRP has reached unprecedented levels, with eleven major asset managers, including Bitwise, 21Shares, Franklin Templeton, and Grayscale, filing for XRP ETF products.
Similarly, whale accumulation has surged to historic highs, with 2,743 wallets now holding over 1 million XRP tokens, collectively controlling 47.32 billion tokens.
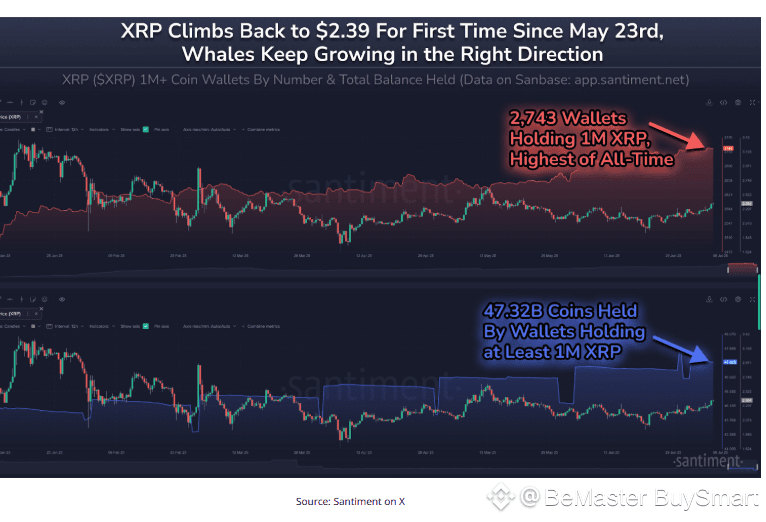
This accumulation pattern coincided perfectly with XRP’s breakout above $2.80, liquidating $31.44 million in short positions at that time.
The positive regulatory movement appears increasingly favorable for XRP’s continued ascent.
Investors anticipate the SEC may vote to dismiss its appeal in the Ripple case, building on the 2023 ruling that XRP sales to retail clients were not securities.
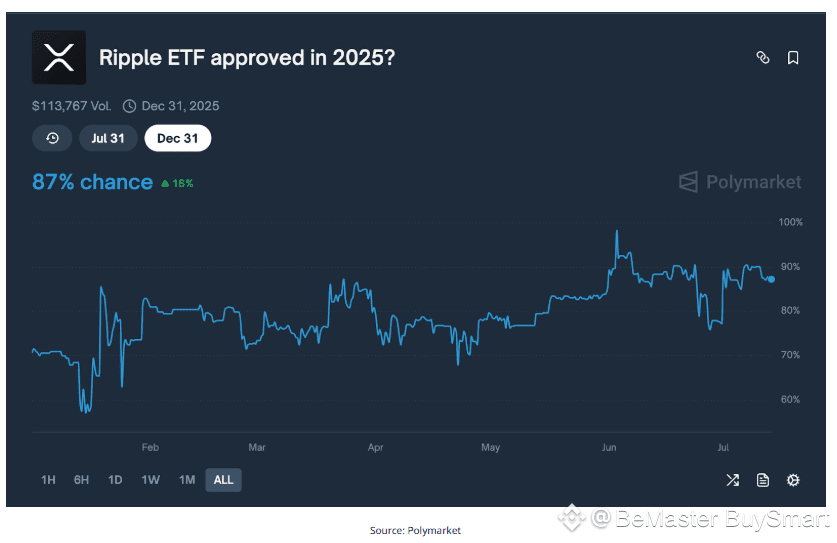
Furthermore, Polymarket data indicates an 88% probability of spot XRP ETF approval by December 2025, while key dates of July 21 and July 25 loom large for leveraged ETF launches and spot ETF decisions.
With altcoin season officially confirmed according to Santiment analytics, XRP’s technical breakout from multi-year patterns positions it for potential moves toward $6 – $8 levels that could surpass its previous all-time highs.
Multi-Year Triangle Breakout Targets $6 Initial Objective
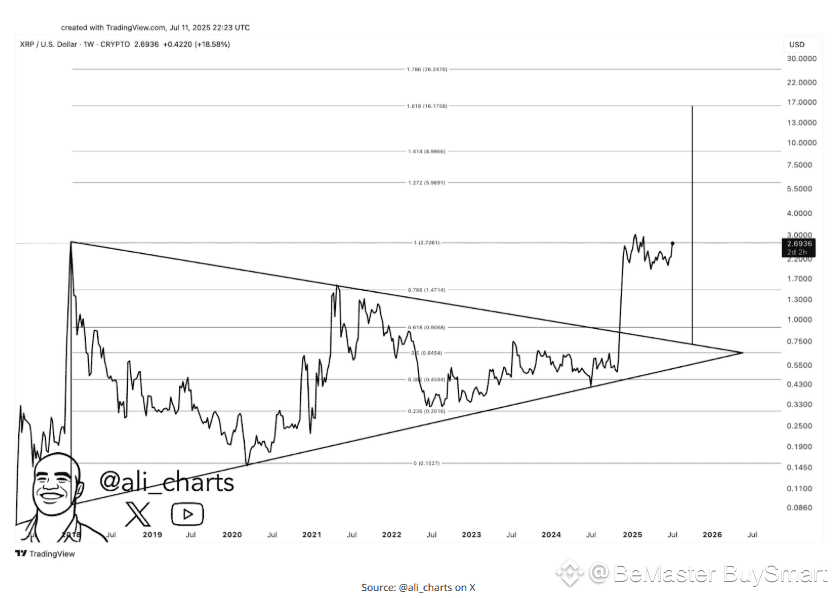
XRP’s weekly chart reveals completion of a massive symmetrical triangle formation that has been building since the 2018 peak at $ 3.84.
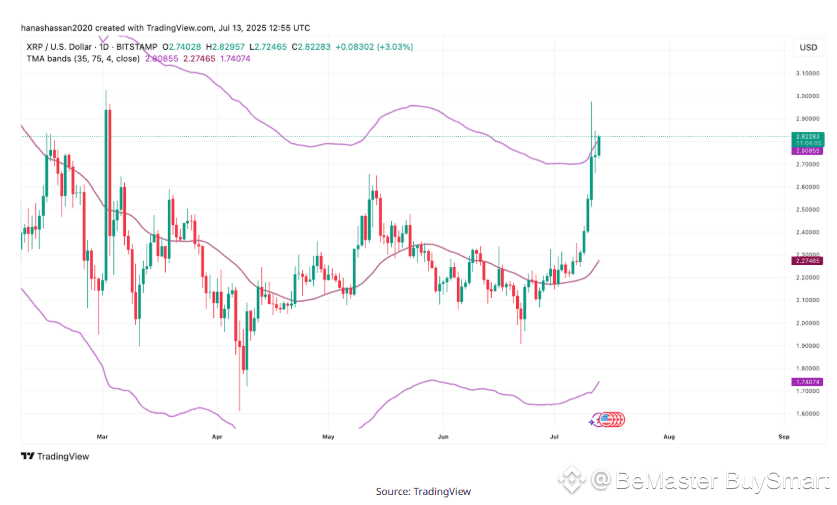
XRP is currently trading at $2.79, having achieved a decisive breakout above the upper trendline of this multi-year consolidation pattern, with explosive volume that confirms the validity of the move.
Fibonacci extension levels provide a clear roadmap for XRP’s potential trajectory. The 1.272 level sits at $5.96, representing approximately 115% upside from current levels.
The 1.414 extension targets $8.99, while the 1.618 level projects $16.18. The most ambitious 1.786 extension reaches $26.35, though this appears reserved for extended bull market scenarios.
Analyst Ali Martinez’s observation that “a weekly close above $3 could set the stage for a rally to $6 or even higher” aligns perfectly with these technical projections.
The symmetrical nature of the triangle formation, encompassing an entire market cycle from 2019 to present, suggests proportionally larger moves when finally resolved.
Volume characteristics during the triangle showed typical declining patterns as the formation matured, followed by increasing volume on the breakout.
This textbook’s technical development indicates institutional and algorithmic recognition of the pattern completion.
The EMA 200 has been definitively reclaimed around $1.05, providing a solid support foundation for the current uptrend.
XRP trading well above all major moving averages confirms the trend has fully established itself.
The immediate resistance zone sits around $3.19, followed by stronger resistance at $4.31 before reaching the initial $6 target zone.
Further Analysis Points to Terminal Wave Toward $5.70
Additionally, the Elliott Wave structure reveals XRP completing a macro triangle pattern within wave (4), now advancing through wave (3) of the larger wave (5) sequence.
Third waves typically generate the most powerful and extended moves in Elliott Wave theory, suggesting XRP’s current advance may be just beginning its most explosive phase.
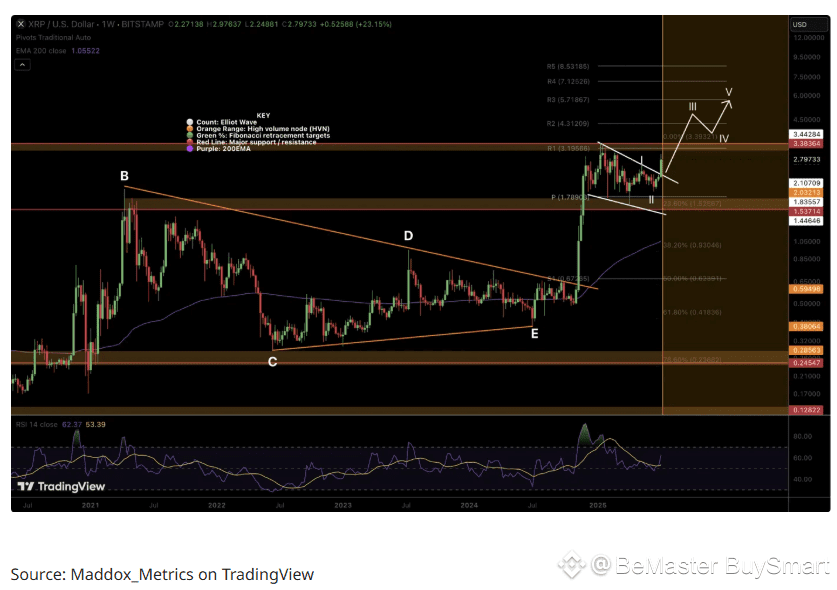
The breakout from the pennant formation around $2.50 confirms the wave (3) initiation with strong momentum characteristics.
In fact, RSI analysis provides crucial bullish confirmation through a completed bullish divergence pattern.
The divergence occurred when price made lower lows while RSI created higher lows, indicating diminishing selling pressure despite price weakness.
The subsequent RSI breakout above 60 validated the momentum shift, with current readings around 61 suggesting substantial room for additional upside before reaching overbought conditions.
The macro triangle completion represents years of energy accumulation that typically precedes terminal waves of significant magnitude.
XRP’s Elliott Wave count places the cryptocurrency in the final stages of a larger degree pattern, with the analyst’s terminal target of $5.70 representing conservative projections based on standard wave relationships.
This target would establish new cycle highs above the previous $3.84 peak set in 2018.
FOLLOW BE_MASTER BUY_SMART 💰💰💰 Appreciate the work. 😍 Thank You. 👍 FOLLOW BeMaster BuySmart 🚀 TO FIND OUT MORE $$$$$ 🤩 BE MASTER BUY SMART 💰🤩
