
Date: July 2025
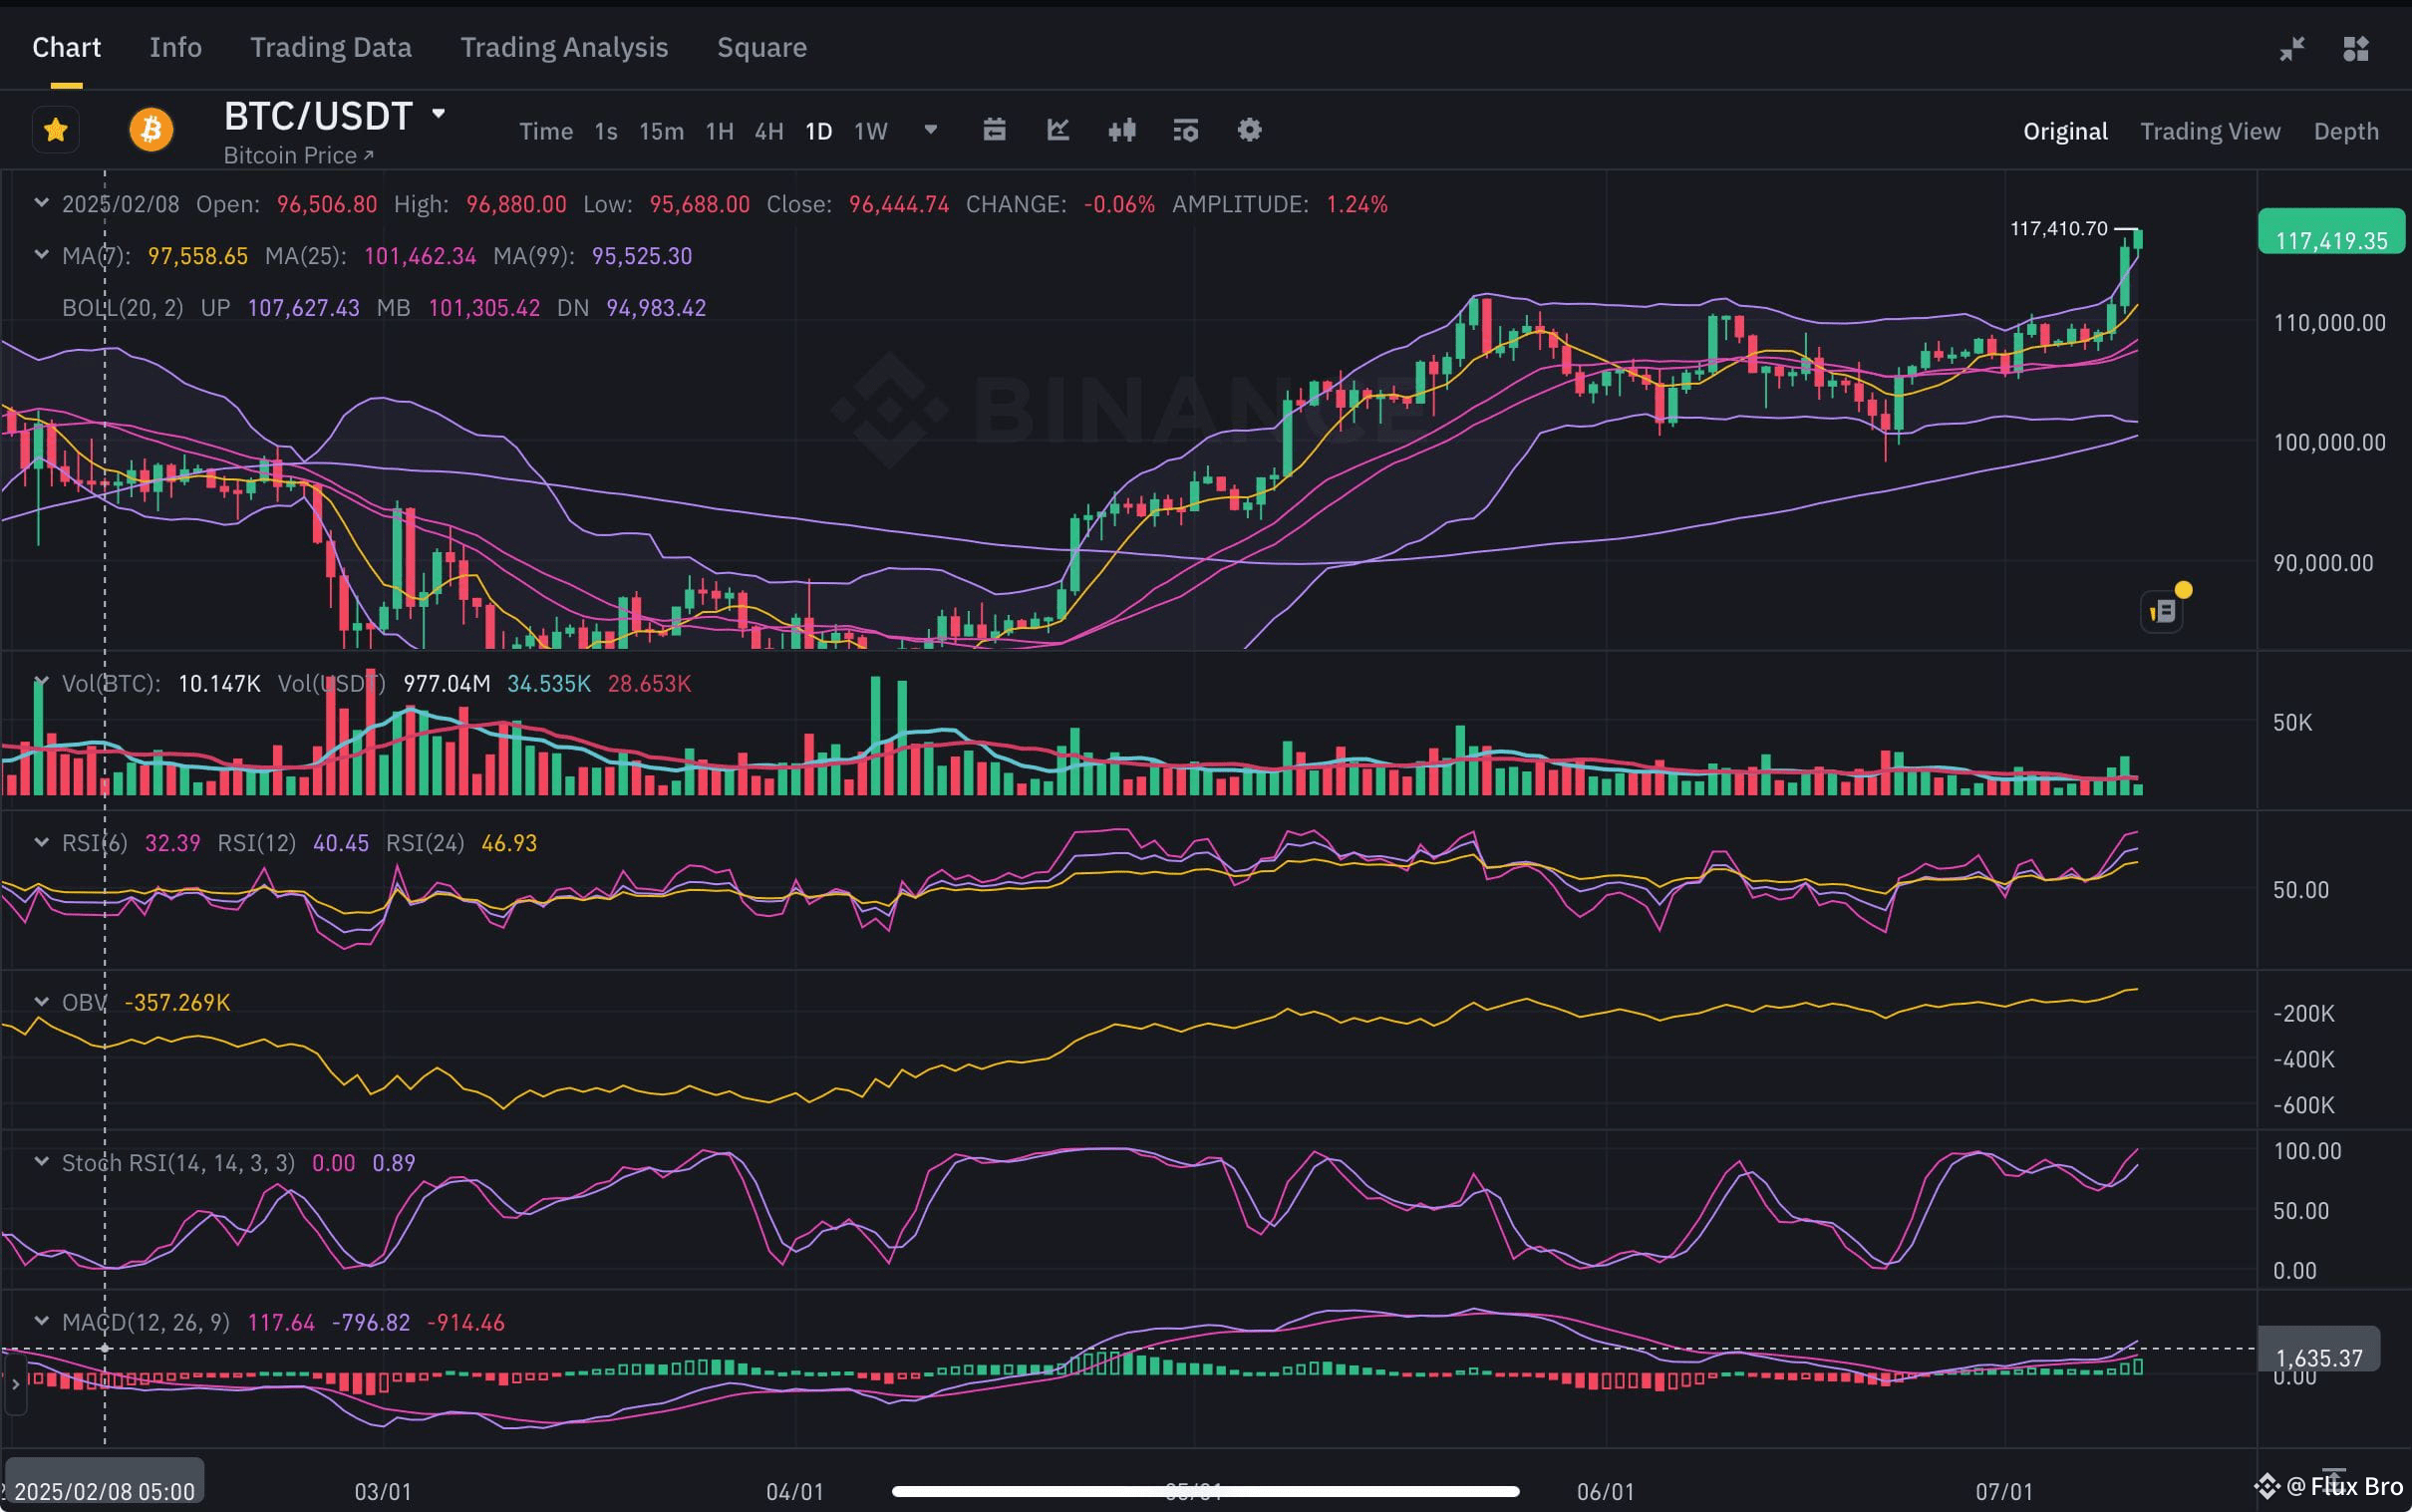
Current Price: $117,419.35
Chart Timeframe: 1D (Daily)
TL;DR Summary
Price breakout confirmed above $117K
Overbought conditions detected (RSI, Stoch RSI)
Smart money likely selling into strength
Resistance zone: $118,000 – $120,000
Support zone: $104,000 – $107,000
Correction likely short-term — high timeframes still bullish
TECHNICAL BREAKDOWN
1. Price Structure & Momentum
BTC recently broke out of a consolidation range (~$105K–$112K).
Strong momentum candles are forming with rising volume, confirming buy-side conviction.
New local highs are being printed at $117,410.70.
Interpretation:
We’re seeing the kind of expansion that typically follows a textbook Bollinger Band squeeze breakout.
2. RSI (Relative Strength Index)
RSI Setting
Value
• RSI(6): 32.39
• RSI(12): 40.45
• RSI(24): 46.93
Meaning
• RSI(6): Neutral to slightly oversold (short-term)
• RSI(12): Below midline, slightly neutral
• RSI(24): Approaching overbought territory
Interpretation:
• Medium-term momentum is building but not yet overcooked.
• RSI(24) approaching 50+ signals there’s still room to move higher before the market gets overheated.
3. MACD (12, 26, 9)
MACD Line: 117.64
Signal Line: 796.82
Histogram: Slight bullish uptick
Interpretation:
A clear bullish crossover previously occurred.
The histogram shifting positive shows momentum is continuing, but it’s at a potential inflection point.
4.Stochastic RSI
%K: 0.00
%D: 0.89
Interpretation:
Extremely overbought, often preceding a short-term correction or consolidation.
Look for a cool-down dip to enter again.
5.Volume & OBV (On-Balance Volume)
Volume increasing on the breakout confirms bullish momentum.
OBV: -357.26K, still low historically.
Interpretation:
Price has moved faster than volume, indicating potential divergence risk.
Smart money may be distributing into the breakout — watch for volume divergence.
SUPPORT & RESISTANCE ZONES
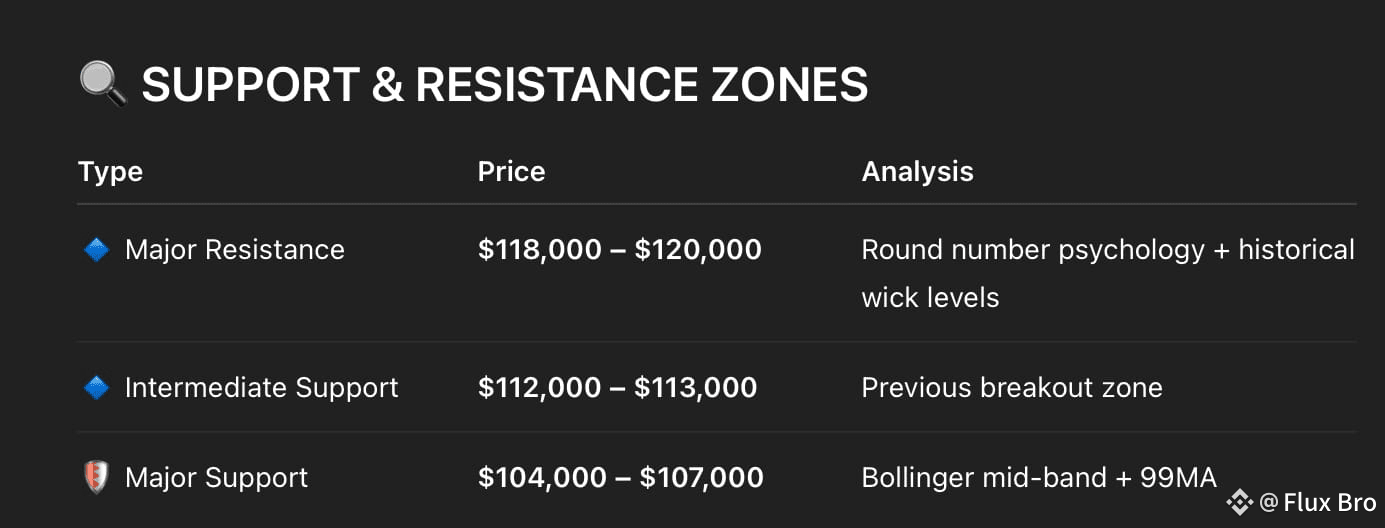
Entry Zones to Watch:
If BTC dips to $112K and finds support, this could be an ideal re-entry.
A breakdown below $104K signals the trend is in trouble short-term.
MOVING AVERAGES CHECK
MA(7): $97,558.65
MA(25): $101,462.34
MA(99): $95,525.30
Interpretation:
The price is far above all key moving averages, indicating an extremely strong trend.
However, a retracement is healthy and expected.
BULL RUN CONFIRMATION OR TRAP?
This breakout looks clean, but the market is rarely kind to late entries. Smart money accumulated between $90K–$105K — this pump could be their exit liquidity opportunity.
STRATEGY GOING FORWARD
If You’re Long:
Set a trailing stop-loss at $113K.
Scale out partially near $118K–$120K.
If You’re Waiting:
Avoid FOMO.
Wait for retracement near $112K or $107K.
Monitor RSI(24) for cooldown — an entry opportunity if it drops below 40.
Always track volume — if there's a price pump without follow-through volume, it could be an exit signal.
"The best trades are made not when it feels safe, but when it’s boring."
This current move is explosive, but it could be the tail-end of a wave, not the start. Watch volume, watch RSI, and stay patient.